The song we selected to embody the sentiment of the stock market this week is, “Don’t Let Me Down” by the Chainsmokers. After a 34.8% rally off the March 23 lows, the market is attempting to digest and consolidate its fast gains before determining the next move. We’ll discuss the pluses and minuses moving forward. But for now, the lyrics of the week…
Don’t let me down
Don’t let me down, down, down
Don’t let me down, down, down
Don’t let me down, down, down
Don’t let me down, don’t let me down, down, down
The Warren Buffet Shock
I think the shock of the year came this weekend during the Berkshire Hathaway annual meeting. Many of my fellow “value” tilting investors sat in anticipation of the “Oracle’s” disclosure of new purchases, positions, outlook – all of which were not forthcoming. Let me explain what I mean:
Airlines:
After historically shunning ownership of airlines (as a result previous bad experiences), Berkshire invested pretty aggressively in recent years to own AAL, UAL, DAL and LUV (~$8B bet). This weekend we learned that Buffett bailed on all four and sold at a steep loss.
On Monday, Greta Wall from OANN had me on her show to discuss what happened. Here was my take:
Is Warren as Bearish (Short Term) as Most People Took Away from The Annual Meeting?
So while Warren said to always “Bet on America” over the long term (and to own an index fund without leverage), it came in the context of a slide presentation that emphasized buying at the wrong time during the “Great Depression” would have taken 21 years to get back to even.
Now I’m all for helping my kids and grandkids (if I get any), but waiting 21 years is not my idea of a smart bet (long term or not), and I think that’s what had many people concerned (particularly when we are getting “Depression Like” economic data in the short term – due to the voluntary shutdown of the economy).
There were eight points that Warren Buffett DID cover that may in fact imply a level of “bullishness” greater than the consensus takeaway:
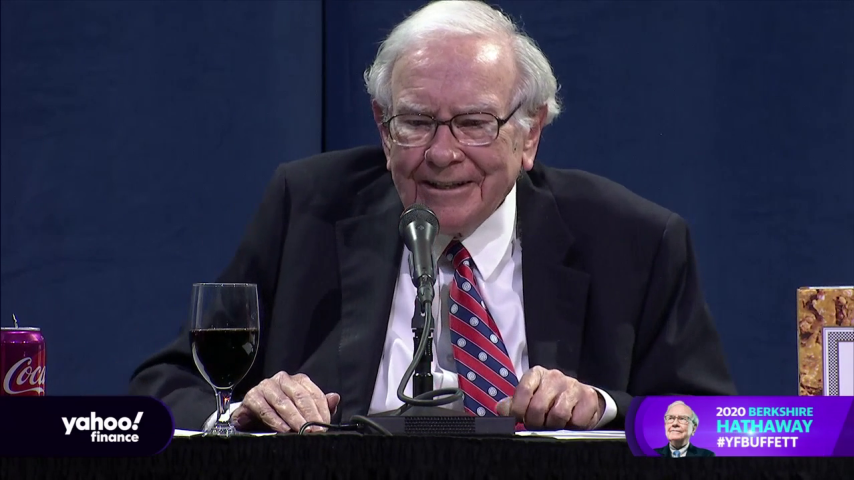
- Warren said if a deal came to him on Monday he’d be willing to put $30-$50 Billion to work immediately.
- He also mentioned, in passing, that he had to keep reserves as he could not quantify the potential “knock on” exposure in a worst case scenario. Given that he has $137B of cash and is willing to do a deal of “up to” $50B, it tells me he has quantified a maximum insurance exposure as high as $50-80B from Coronavirus. You are seeing this level of uncertainty in the insurance sector stocks across the board. No one can perfectly handicap the exposure, so people just assume the worst.
- Since Berkshire’s potential insurance liability is unknown (or potentially as high as $50-80B in a worst case outcome), he cannot buy stocks (or companies) in amounts greater than $30-50B – even if he wanted to right now.
- Investors across the industry are feeling confused, unsure if insurers will be on the hook for Covid-19 related problems. There have been anectodes of portfolio managers at big insurers that were forced to not put new money to work – by mandate.
- Buffett explicitly stated that for the industry, “the amount of litigation that is going to be generated out of what’s already happened, let alone what may happen, is going to be huge … just the cost of defending litigation will be a huge, enormous expense.”
- Berkshire’s investment portfolio had a $54.5 Billion hit in Q1. This may also have impaired his ability to put more money to work in the short term – as pressure of “un-quantifiable” insurance exposure and massive short term portfolio impairment – led him to take the cautious path of preserving cash until more clarity revealed itself.
- He made an off-handed comment that many of his shareholders had the majority of their wealth in Berkshire’s stock – and that most of them (including a large number of his family members) were of retirement age (and could not earn it back if lost). He took that weight very seriously and made sure other shareholders were aware that while he hoped to beat the S&P 500 over the next 10 years, her could not guarantee it. Ask any investment manager if they can beat the S&P 500 (over time) with 100% invested and they will say, “maybe.” Ask them if they can do it with one arm tied behind their back (30% of the assets in CASH) and they will say, “impossible.” Right now Berkshire has ~30% of its assets in cash. It will be very hard to match the S&P unless a good portion of that cash is put to work. Warren is no longer running his vehicle to “shoot the lights out” as he may have done in the early part of his career. He is running it like a utility (slow and steady) and he made that abundantly clear to shareholders on Saturday. He is also at the mercy of the “law of large numbers.” It is much harder to find a deal when you are operating in $30-50B chunks as the assets are coveted and usually efficiently priced. This contrasts to the earlier part of his career – when he was small and dealing in more inefficient pockets of the market – which led to the current ~91,000% return to date.
- The most important factor that I think impacted Buffett’s ability to buy material amounts of stock OR execute a large deal is that unlike 2008-2009 – when he had no competition and was the “lender of last resort,” in March the Federal Reserve and US Treasury stepped in with ~$9T of stimulus, aid and liquidity – before Buffett had any chance to act. They were so quick and forceful, that Buffett commended Chairman Powell for being as effective as Paul Volker was in the early 80’s. The good news is they backstopped the market. The bad news is Warren’s phone stopped ringing within days after it started ringing – hence no deals were done… The government beat him to the table.
Is Demand Finally Bottoming?
As I said in the last two weeks’ notes – when I outlined the magnitude and granularity of over $9T of stimulus/aid/liquidity (asphalt), to fill a $1.5T economic contraction (pothole), – we would not feel the effect of this money until DEMAND came back:
Demand would return only as people slowly and safely went back to work. It’s now happening. Here is the data:
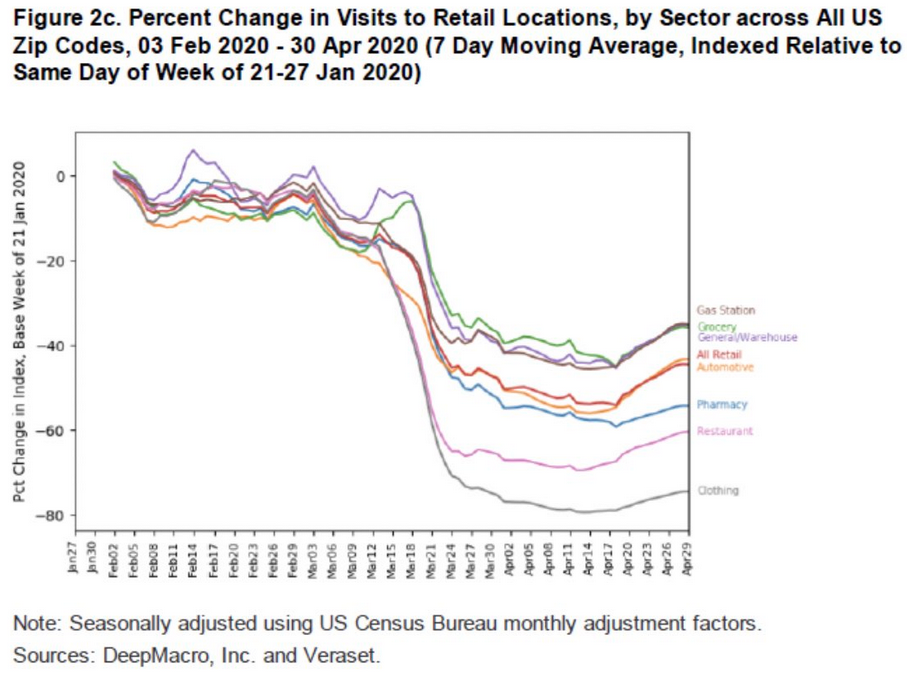
- Percentage Change in Visits to Retail Locations (source: Fundstrat)
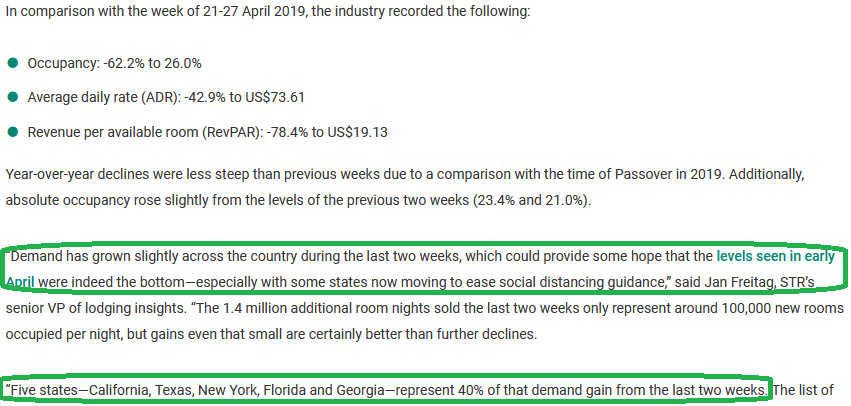
- Hotel Occupancy rates (while down materially yoy) picked up in the past two weeks (source: STR.com)
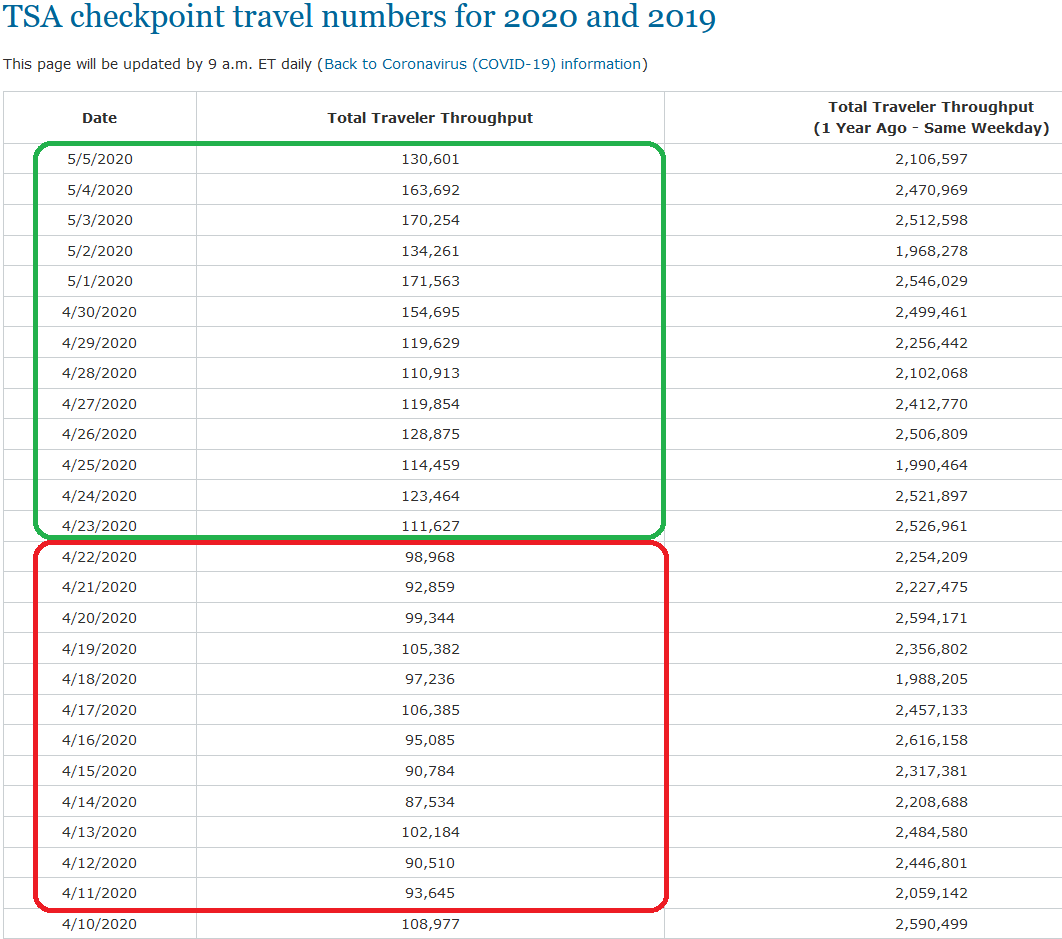
- Air Traveler Checkpoint Numbers are up in the US in the past 2 weeks (source: TSA)
- Global Air Travel is up 4% week on week (source: Cirium/ThePointsGuy)

- Daily gas demand up 18.66% from four weeks ago trough (source: GasBuddy)

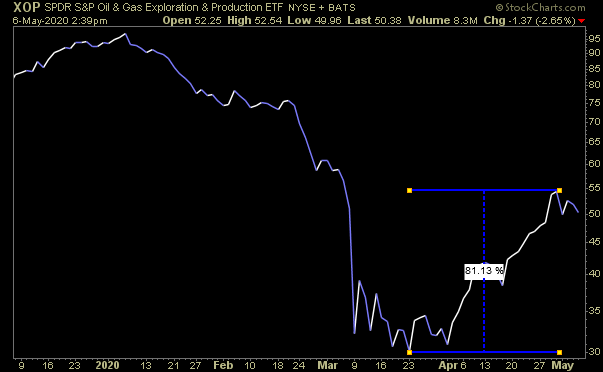
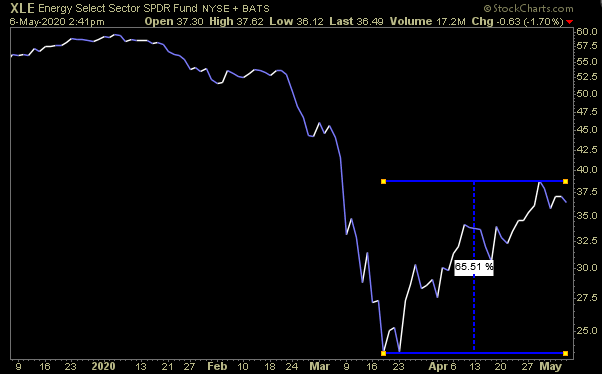
- Energy Stocks are starting to sniff out a slow and steady recovery in demand – outpacing the recovery in the S&P 500 by 153% (XOP – Exploration & Production Sector up 81.13%) and 104% (XLE – Energy Sector/Integrateds up 65.51%) respectively:

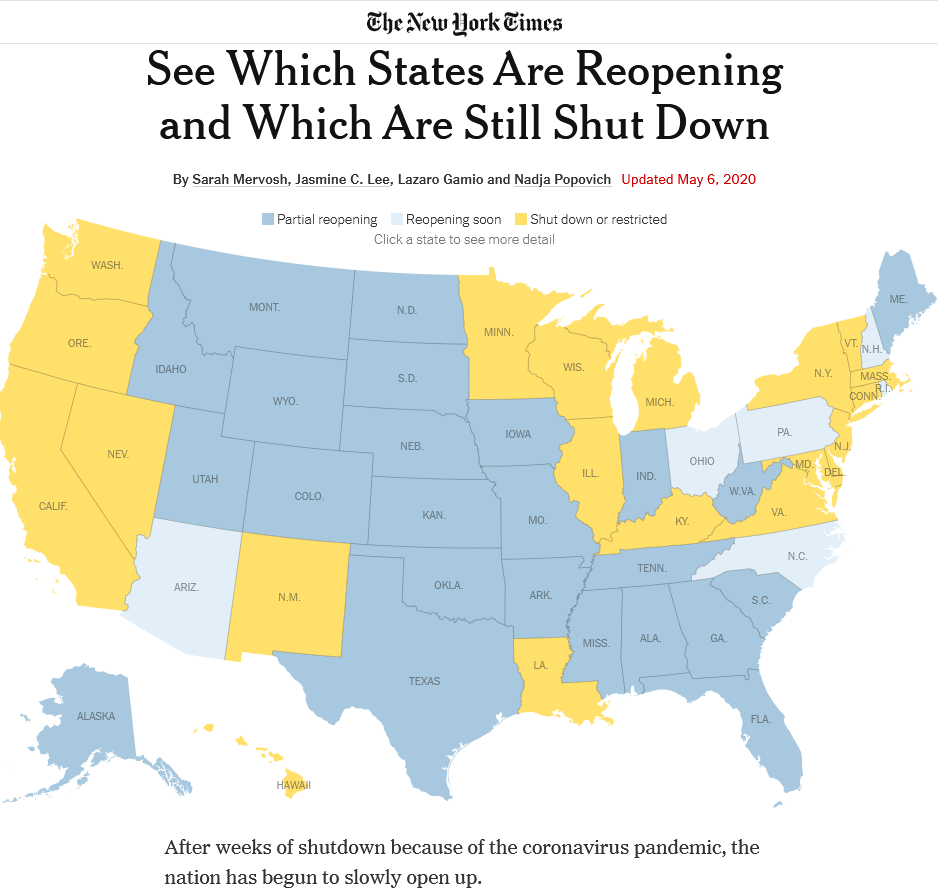
- Reopening the Country: While Florida, Texas and Georgia have reopened for business (and approximately 30 States in total opening for business in some form), by this Sunday, at least 43 states will have eased some restrictions – ranging from simply reopening parks to allowing more businesses to reopen. You can see what each state is doing here: (CNN)
What About Jobs/GDP?
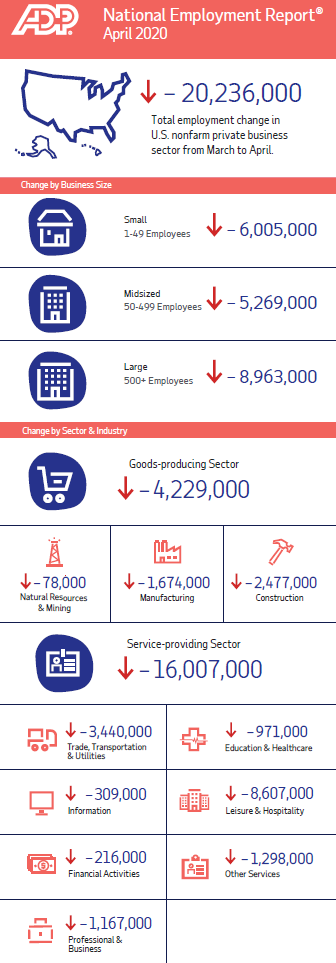
On Wednesday, the ADP National Employment Report came in slightly worse than expectations -20.24M vs -20.05M. Expectations are very low so the market is looking through the short term pain as states reopen and demand recovers. Here is the data from ADP by sector:
- Expectations for today’s initial jobless claims are 3M (source: investing.com)

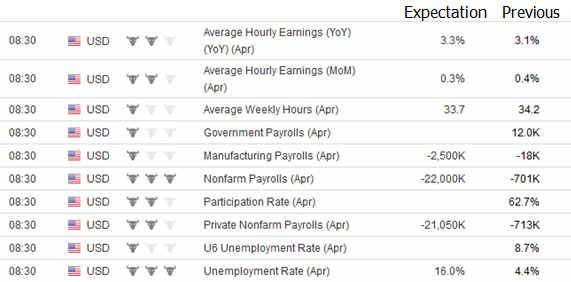
- Expectations for Friday’s Employment Report are (source: investing.com)
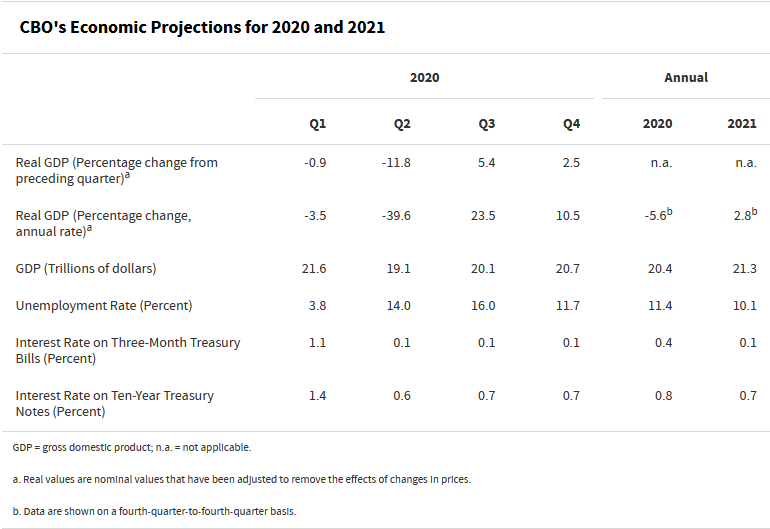
- CBO Estimates for Employment and GDP are as follows for 2020/2021 (source: Congressional Budget Office):
- Dallas Fed GDP Estimates Over Time:

- Atlanta Fed: Results from our March Survey of Business Uncertainty (SBU)—a national survey of firms of varying sizes and industries—revealed that disruptions stemming from COVID-19 had led to sharp declines in expectations for year-ahead sales growth. Our April survey, which was in the field from April 13 to April 24, suggests that year-ahead sales growth expectations have only grown bleaker and more uncertain.

So What to Make of It?
As you can see in the data above, expectations of business participants are no different than expectations of market participants. They follow the same idiom I learned from my first Hedge Fund boss, “Opinion Follows Trend.”
As the short term data got worse, businesses and economists took expectations down dramatically. With demand slowly kicking in as we re-open the country in coming weeks and months – expectations are at an all time low – which sets a bar that may be very easy to step over.
The risk is that we open too soon and have to take steps backward. I think at this stage, society is near a tipping point that the economic/societal pain may be as bad/worse than the pain of higher mortality rates in the short term. It’s a question of balance and trade-off. Society made the ultimate sacrifice for two months by shutting down and largely following “shelter-in-place” rules in order to save those most at risk.
Now the cost of that shared sacrifice is being felt by millions of jobless claims, small business insecurity and psychological/monetary damage for millions. The curve has flattened, now it’s time to move back into action and take the short term case spike risk that may be associated with that decision. It will be bumpy few months but we’ll come out on the other side better than before.
To top it off, a new phase 4 stimulus bill is on the table. As it is in the rough stages, many proposals are currently on the table (all in the ballpark of ~$1T). All proposals are still being debated and are not final:
- $1T Infrastructure Package
- $500B State/Municipal Aid
- Monthly payments of $2,000 given to most Americans until the crisis begins to fade
- Suspension of all payroll taxes paid by employees
- Negative Payroll Tax (Art Laffer/Supply-Side idea to get money into business without 3rd round PPP)
- More money for Paycheck Protection Program
- Reduction in the capital gains tax rate and measures that would allow companies to deduct the full costs of any investments they make now or in the future
- Expand or make permanent provisions of the sweeping tax overhaul President Trump signed into law in 2017
- Immediate deduction provision, known as “full expensing,” to structures — allowing anyone who buys a building to write off its cost right away
- Expansion of business deductions for meals, entertainment and sporting events
- Liability reforms to protect employers from a rash of lawsuits believed will be aimed at them after the pandemic clears and businesses reopen
Remember: We will only start to feel the effects of the $9T+ (stimulus/liquidity/aid) when demand starts to recover (people go back to work). I think we are going to be shocked by Q4 2020/1H 2021 what type of growth rates kick in as the excess $7.5-8.5T (over and above the $1.5T economic contraction) finally starts to circulate…

For those of you following my thesis on an imminent rotation into banks, I tweeted this out on Tuesday. While everyone looks at rates and NIM (Net Interest Margin), they are missing $20-30B of earnings that are going to show up in Q2 from PPP origination fees:

Now onto the shorter term view for the General Market:
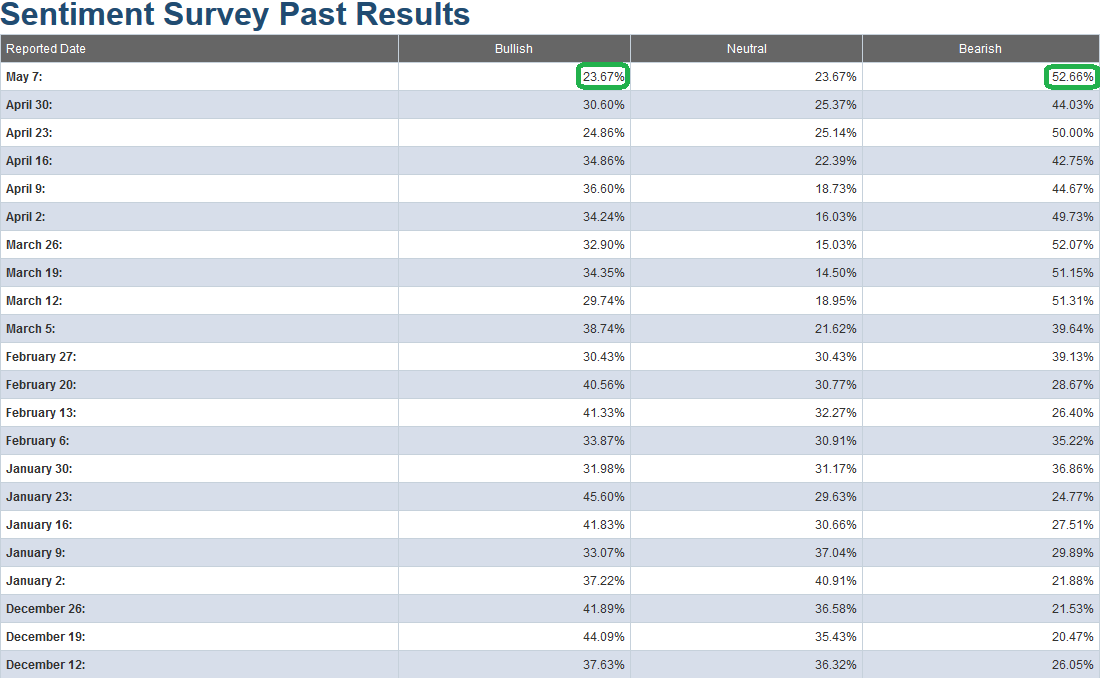
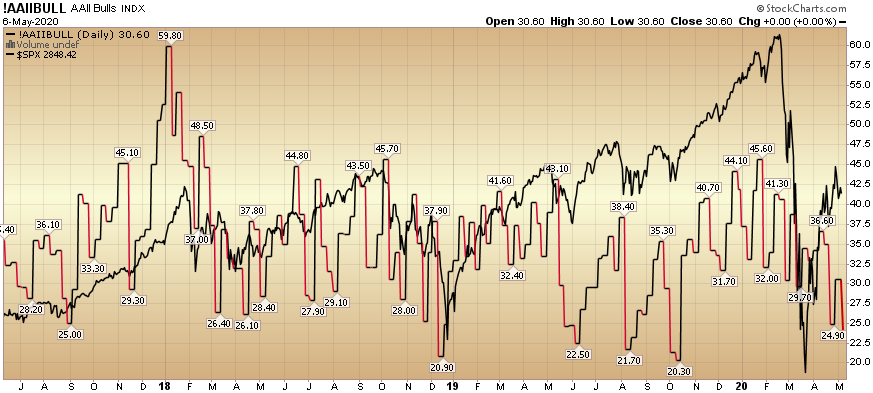
This week’s AAII Sentiment Survey result Bullish Percent (Video Explanation) dropped to 23.67% from 30.60% last week. Bearish Percent jumped to 52.66% from 44.03% last week. Fear is back and near an extreme level for individual investors. The market continues to climb this wall of worry. As you will see on the chart below, reads like this are generally found near short term bottoms versus tops.
The CNN “Fear and Greed” Index fell from 46 last week to 40 this week. The fear continues to slowly thaw and will move in fits and starts in coming weeks. You can learn how this indicator is calculated and how it works here: (Video Explanation)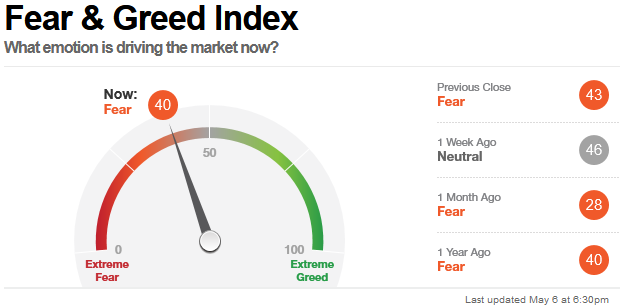
And finally, this week the NAAIM (National Association of Active Investment Managers Index) (Video Explanation) jumped from 45.34% equity exposure last week, to 78.55% this week.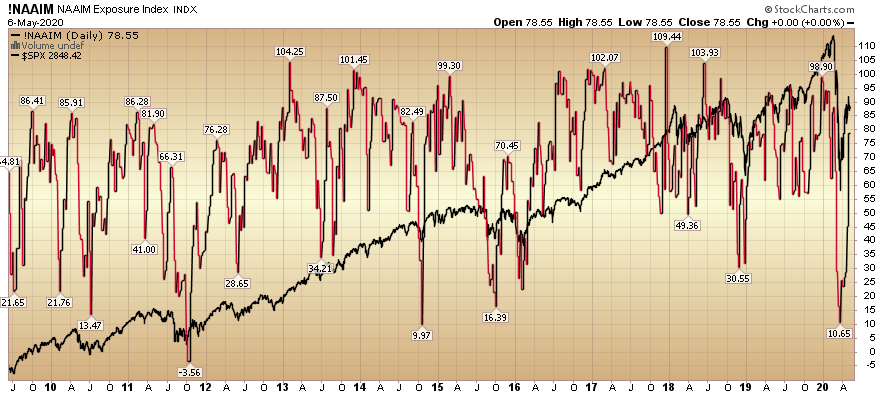
As I said for the last few weeks, “Active managers will have to regain exposure in coming weeks as the worst of the news starts to move into the rear view mirror.” After a 34.8% rally off the March 23rd lows, they are finally chasing in the past 1.5 weeks.
Our message for this week:
Because we have taken advantage of most of the best discounts that were available in equities (during mid-March to early April – see previous weekly notes under “sentiment” category of the site), we shifted focus in the past few weeks to start picking up a selective portfolio of distressed high yield credit – that has fallen materially since the advent of COVID-19 (i.e. some bonds have fallen as much as 40-60% in the past 8-10 weeks – from par).
There are selective pockets that have not recovered to the same extent as the equity markets have. We believe that many of these securities will recover to par over time as credit markets repair and government provided liquidity (see last week’s note that explained liquidity programs) finds its way to this distressed corner of the market.
We also have dry powder available to add to equities in the event we do get a re-test (or lower in coming weeks and months), but that appears to be a low probability at this point. If the facts change, we will adjust, and be ready to take advantage. But for the time being, the bulk of the opportunity is in a selective basket of researched individual distressed credit securities (and holding the equities we already own).
As was our repeated plan in the previous weeks (prior to early April) of buying the highest quality equities on every red/down day (and sitting on our hands on green days), we have followed and will follow the same template in the high yield credit markets.


