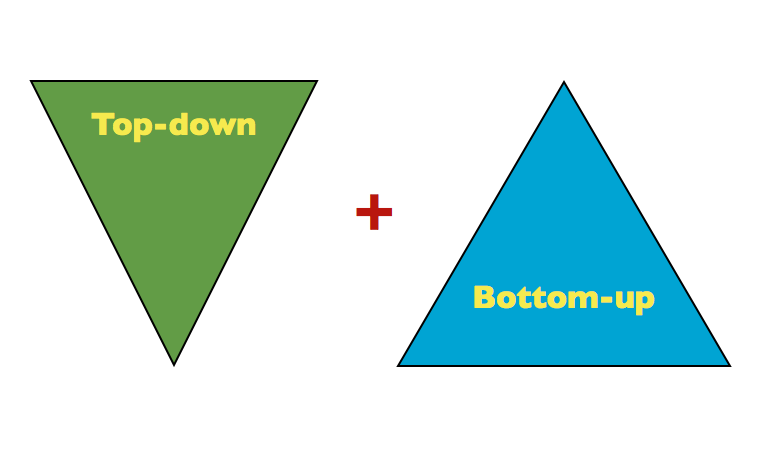
I was asked to write an article by the CMT Association on how we use charts in our investment selection process. The answer is, we spend 80% of our time on fundamental analysis and 20% on using technical barometers to assist with entry and exit timing.
PHASE 1 – The Market:
On a technical basis, we start “top down” – with the general indices – to get a sense of whether it makes sense to be aggressively adding risk or lightening up. Since no single indicator or oscillator is fool proof, we try to look at a few dozen to see if they are pointing to the same probabilities – or diverging in their readings.
While many technical analysts prefer to buy when there is high relative strength and “blue skies” on “breakouts,” we prefer to buy high-quality durable franchises when they are on sale. We are looking for periods when selling is at or near exhaustion versus buying when everyone is already clamoring for the stock or sector. While this may require slightly more patience – as building bottoms can take time – if you have done proper fundamental analysis and know what you own (as well as understand the time value of money), buying quality (when trading below intrinsic value) and selling when the masses are exuberant for the company (after it has exceeded intrinsic value), is a process that has created material wealth for practitioners over many generations and through many cycles. Here are a handful of indicators we look at to get a feel for the general market:


PHASE 2 – Sector Rotation:
Once we have a feel for the general market climate, we drill down to see which sectors are on sale. When we have determined what is at/near selling exhaustion – we do deep-dive fundamental analysis to determine WHY. Sometimes stocks and sectors are cheap for a reason. We look to identify catalysts that will turn the tide in a reasonable amount of time. We use sector barometers like percent of stocks in a sector above their 20 and 50 day moving averages, Bullish Percent (by sector), and ratio charts of the sector relative to the general indices. Here are some barometers that we go through for each sector to identify potential opportunities: 


PHASE 3 – Stock Selection:
After we have determined the climate of the general indices and identified sector(s) that may be offering the greatest opportunity, we run a simple “oversold” (relative strength) screen to see a few dozen large cap, high quality companies, in the targeted sector. Then the real work begins to find those franchises that are cheap for a reason (to avoid), or cheap due to sector rotation or some short-term bad news/exogenous event that has caused it to be misappraised in the short term:
The above names are for illustrative purposes only. We covered specific names in our podcast|videocast on September 16th and 23rd.
Value:Growth
On Friday I was on Fox Business – The Claman Countdown – with Liz Claman. Thanks to Liz and Ellie Terrett for having me on:
Here are the show notes I sent over for the segment – which was focused on the selloff in Nike (due to supply chain issues) – as well as my general outlook and picks for the market:
Nike Notes:
- The fallout from NKE’s supply chain issues and lowered guidance has incited sympathy weakness in several shoemaker/distributors: UAA, CROX, DECK, SKX, FL
- NKE has lost 10 weeks of production since mid-July (largely due to factories in Vietnam).
- Pre-pandemic it would take ~40 days to move product from Asia to North America. Due to container shortages, port congestion, rail congestion, and labor shortages, transit time is now up to ~80 days.
- Demand is there, but they had to take down revenue guidance from low double digits to mid single digits. Short term issues outside of their control.
- Wait a few days for it to settle out and hear from peers before considering position. Trading at 30x next year’s earnings with 18% earnings growth. A little rich at these levels – wait for better entry.
General Market Notes:
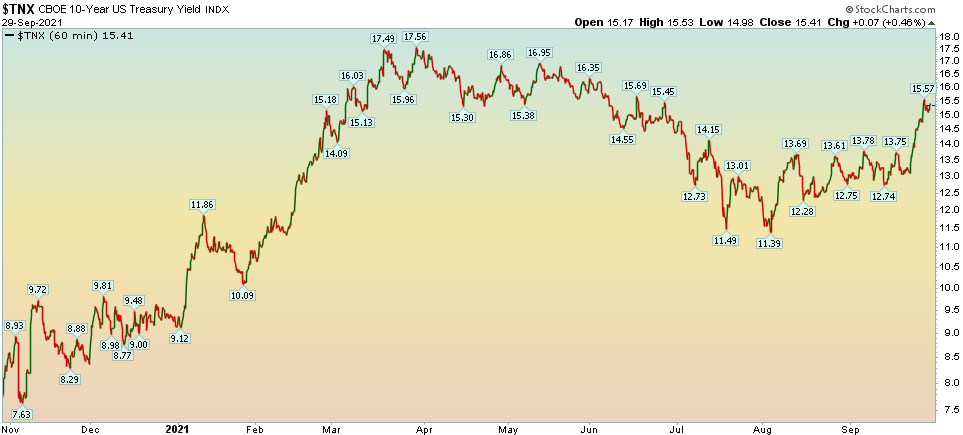
–10 year yield moving up on the back of Fed Meeting 130 -> 145bps in 3 days. As was the case from Nov 2020-March 2021 (when 10yr yield jumped from 75bps-175bps), Value/Cyclicals/Re-Opening trade will be the leaders in a rising rate environment. Tech/growth will take a back seat after a hot summer. This week was the inflection.
–Rates will climb into year-end on the expectation of Taper (which will likely be announced in December, not November). Powell said he needed to see a “decent” employment report to move ahead and we will only see the September Jobs report (early October) before the Nov 2 meeting. Based on Delta fears in early Sept. and Continuing/Initial Jobless claims yesterday, September’s numbers are likely to miss expectations – like August did. October and November reports should be strong enough for him to announce in December.
–Last week we talked about Cruiselines (NCLH, CCL) and Airlines (UAL, LUV) in expectation of the Fed meeting/Global Covid Cases slowing down. They are moving up nicely this week with more upside to come.
This week we want to get more exposure to Industrials and Aerospace as value/cyclicals will lead into year-end. Our picks are:
LMT – Lockheed Martin fell ~15% off its summer highs as Industrials/Aerospace fell out of favor. With the re-opening trade back in play (which favors short-duration earnings cyclicals/value over long-duration earnings tech/growth) we believe this stock can work back up to new highs over the next 6-9 months. It will earn 27% more in 2022 than it did pre-pandemic (2019) and yet is trading at an 18% discount to its pre-pandemic highs. Trades at 12.45x next year’s earnings and pays 3% dividend while you wait. F-35 fighter pilot (largest weapon program in history) will fuel earnings for decades to come.
BA – Just returned to profitability for first time since onset of pandemic. International travel re-opening. Business travel will return in Q1. Just increased its guidance this week for China demand to exceed $1.47T (8700 new airplanes) over the next two decades. Next catalyst will be the flight approval of the 737Max in China – as it was recently approved for flight in India in recent weeks. They operate in a duopoly and pent-up demand will exceed their ability to supply for years to come.
____________________________________
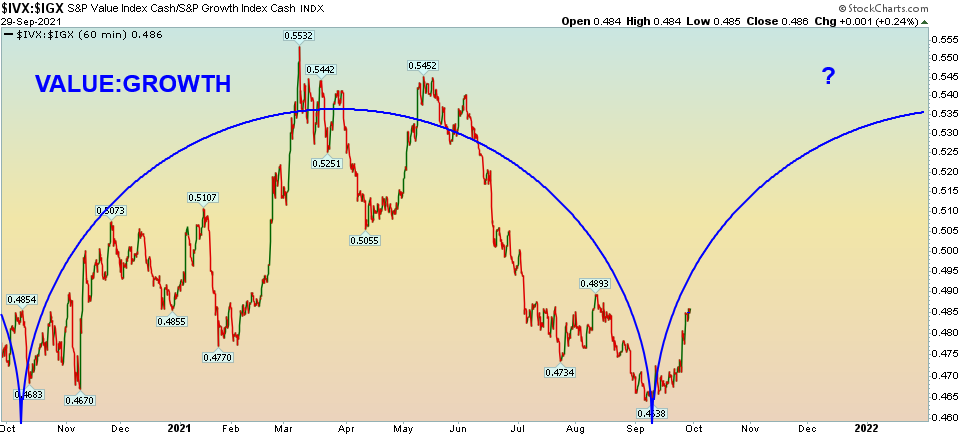
On September 16th, we posted this chart when the ratio of value:growth was at a 1 year low. Our commentary was:
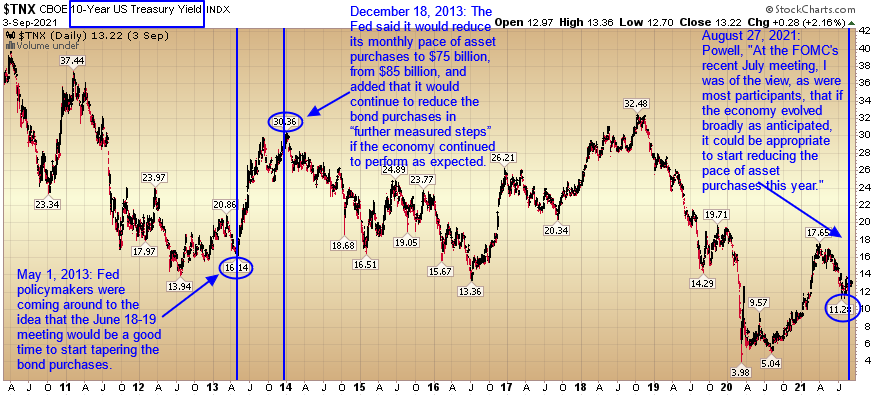
“Rotation: IF we follow the same pattern leading up to the taper implementation as we did in 2013, the 10-yr yield should approach ~2% by Q1 2022 – even if we have some short term fits and starts.
This is supportive of those “re-opening” sectors that have taken a breather since Q2 (small-caps, emerging markets/commodities, value/cyclicals):
Because of their (cyclicals, value, re-opening stocks) relative underweight in the general indices (to tech), we could see violent upside rallies in many stocks that have seen “summer swoons” (down ~20-30%) even without the general indices doing much. Mid-single digit gains for the general indices through year-end would be realistic, but some (re-opening) stocks that fell 20-30% from June-September due to delta could be up 20,30,40 and even 50%+ before year-end.”
Here is what has happened since:
 Mother of all Bubbles?
One other subject I want to address this week: There was a permabear on one of the financial networks this week singing the same tune he has sung since 2013, “we are in an everything bubble.” One of the key stats he pointed to was that housing prices are through the roof. While housing prices have gone up at an accelerated pace over the past year – due to a shortage of supply – cost of ownership is STILL VERY LOW. What do I mean?
At the last housing peak – a 30yr fixed rate mortgage (July 2007) was 6.7%.
Your monthly payment on a $1M house was: $6,453

Today the 30yr fixed rate mortgage is ~2.84%. In other words, it COSTS LESS TO OWN A $1.5M home today than it did to own a $1.0M home at the peak of the last “bubble” in 2007.

Many homes in the tri-state (NY, NJ, CT) area are BARELY above their 2007 highs and cost ½ the price to OWN than they did 14 years ago. No one is talking about this.
Here is the long term mortgage pricing data: http://www.freddiemac.com/pmms/pmms30.html
Just remember, if you’re always bearish, you’re bound to be right once every 5-10 years. You’ll sound smart and sophisticated all of the time, you just won’t make much money in the meantime (and when you are YEARS early, you likely lose enough money in the interim that when you are finally “right” you don’t make a net profit).
Keep in mind, in 2013 the 10-yr yield PEAKED when taper actually started – so while everyone is scared at the recent fast move, they may be surprised to find that when the Fed actually begins the taper (likely early 2022), counter-intuitively that may prove to be the peak in yields for years to come:
Now onto the shorter term view for the General Market:
In this week’s AAII Sentiment Survey result, Bullish Percent (Video Explanation) ticked down to 28.1% this week from 29.9% last week. Bearish Percent ticked up to 40.7% from 39.2% last week. Fear is still present at the retail level.

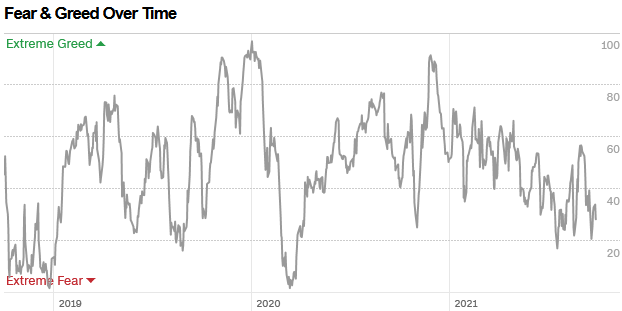
The CNN “Fear and Greed” Index ticked up from 25 last week to 28 this week. Fear is at/near an extreme. You can learn how this indicator is calculated and how it works here: (Video Explanation)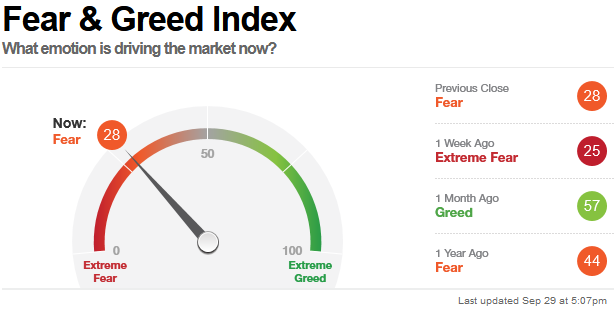
 And finally, this week the NAAIM (National Association of Active Investment Managers Index) (Video Explanation) moved down to 77.7% this week from 87.02% equity exposure last week.
As we said in previous notes, while everyone debated whether we were going to have a “September Swoon” or not, we took a step back and looked for sectors/stocks that have already had a “Summer Swoon” and bought (or added to) the quality stocks that were on sale. We will discuss the progress on this week’s podcast|videocast.

