In recent weeks’ articles and podcast|videocast(s) we’ve made the case that volatility will pick up in 2022 as liquidity slowly starts to come out of the market. When we laid out the case for 2021 (in January) we were expecting high teens returns for the S&P 500 coupled with low volatility (multiple pullbacks contained to 3-5%). That has borne out (and then some)…
Now we are anticipating an increase in volatility for 2022 with high single digit (to low double digit) returns for the S&P 500. We chose Luke Bryan’s country hit “Play It Again” to depict our expectations that 2022 may look a bit like 2014 or 2018 (2013 and 2017 were years that shared the high return and low volatility characteristics that we saw in 2021). 2022 will not repeat those years, but it may rhyme:
Somebody, play it again, play it again, play it again…

Our 2022 expectation for higher volatility and high single digit returns for the S&P 500 is a reasonable expectation considering ~10% earnings growth coupled with back half liquidity contraction (post-taper).
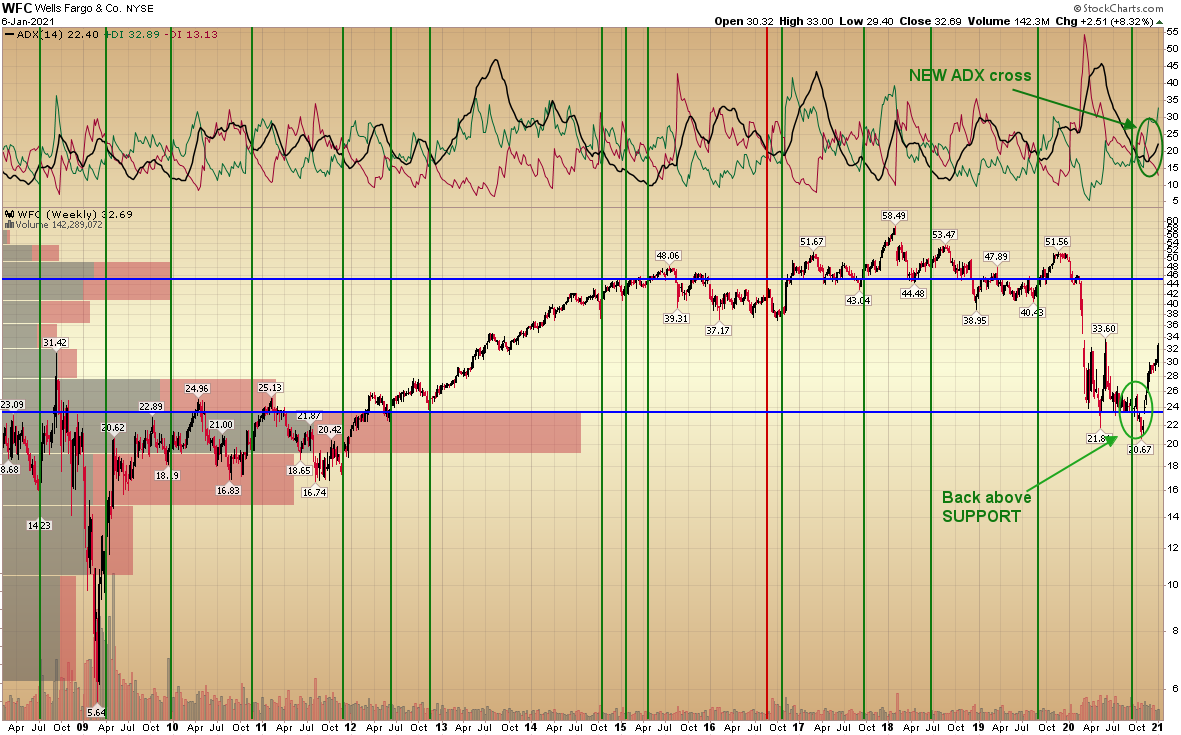
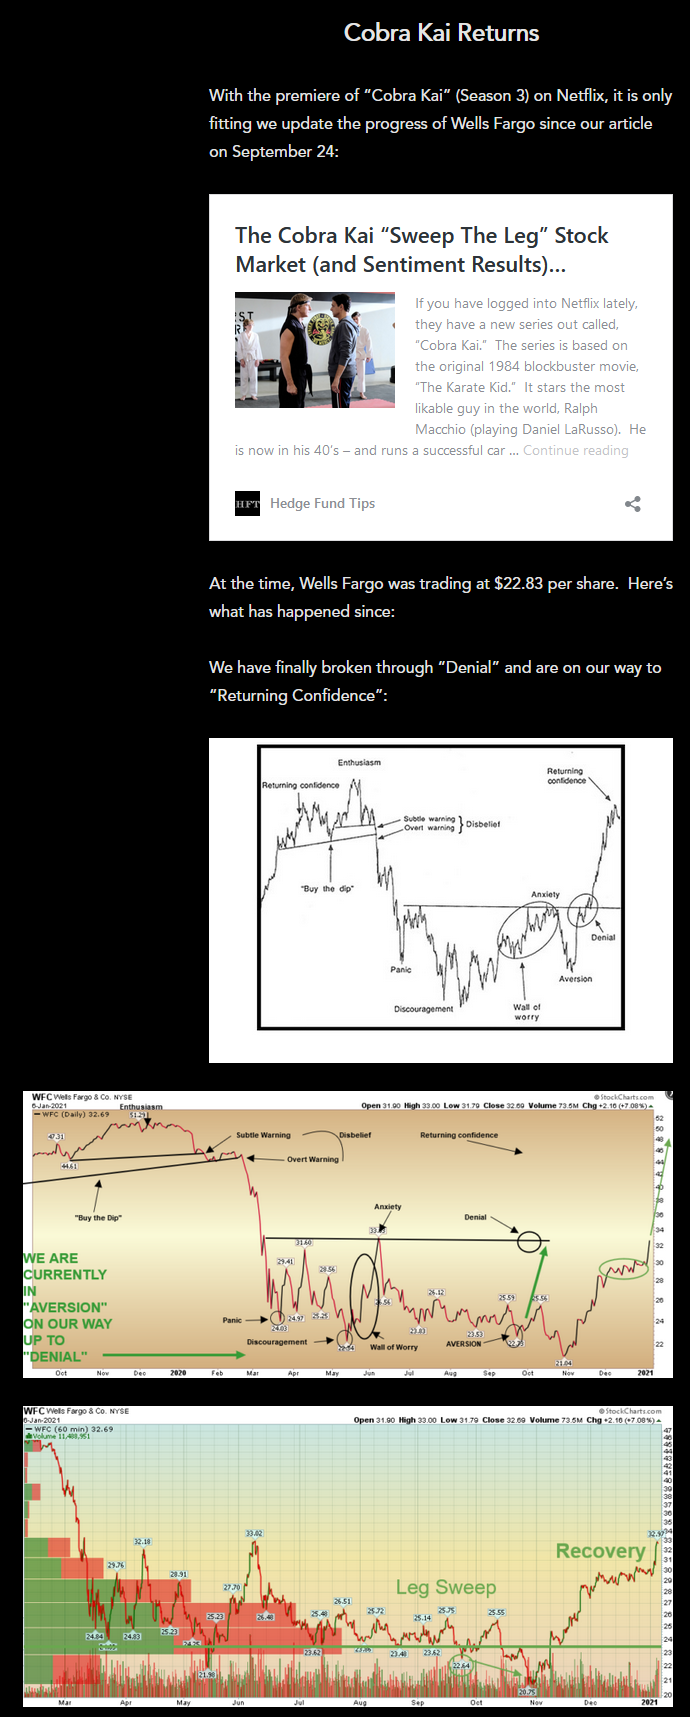
When I was looking back at my January 7, 2021 article, these charts came up – chronicling the ascent of Wells Fargo from our article on Sept. 24, 2020 – when we were buying aggressively in the low to mid $20’s. As we come up on Alibaba earnings today, the resemblance is uncanny:
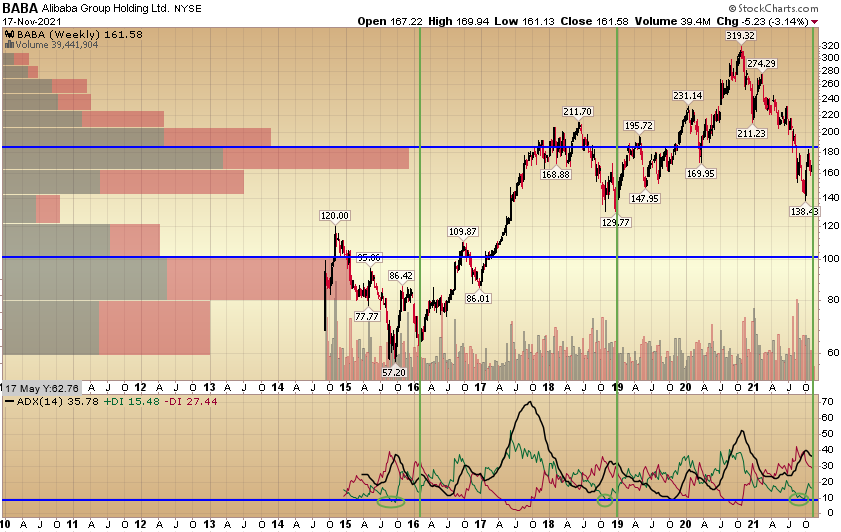
The other similarity of note is the salience of the ADX (which I rarely ever use). You’ll see the three washout periods where the green ADX line got below 10 and then bounced, the next pullback (in green ADX) was the bottom (before an aggressive move up).
Also, if we look at a shorter term chart for BABA like we had above for WFC, the bottoming process (“Leg Sweep” followed by “Recovery”) seems to be following the same pattern:
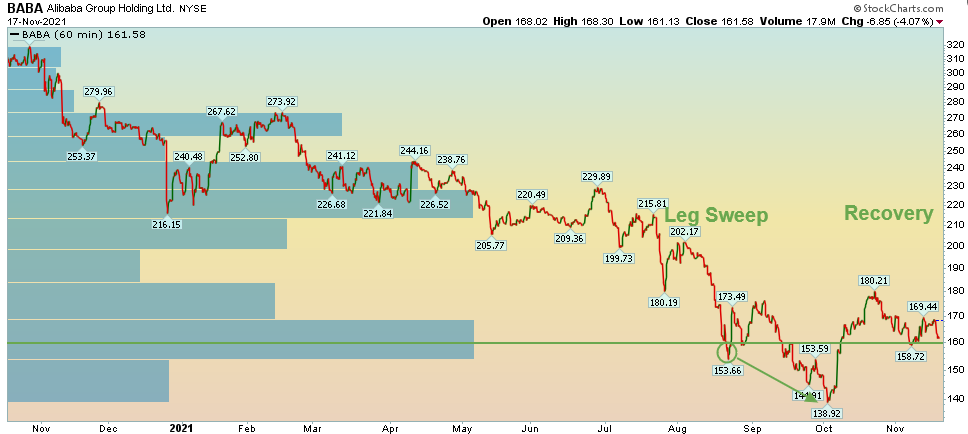
While the patterns are of no use without the general thesis – which is fundamentally based – they do come in handy when the irrationality of the short term “voting machine” is in control. Sooner or later the long term “weighing machine” takes over and the fundamentals prevail – but in the interim – the above analysis can come in handy to get a sense of how long it might take for the “weighing machine” to take over.
Couple that with two data points:
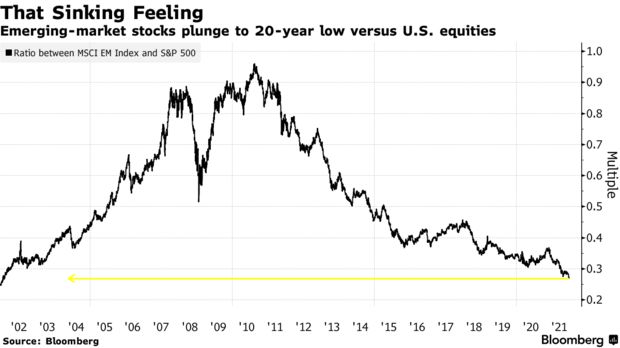
- Emerging markets are trading at the greatest bargain relative to the S&P 500 in the past 20 years. We know what happened next (from 2002-2007 was the biggest bull market in the history of Emerging Markets). China is the largest weighting in the Emerging Markets Indices:
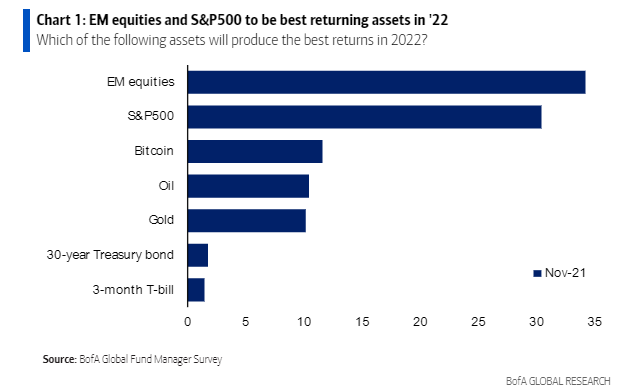
2. In this week’s BofA Global Fund Manager Survey, ~300 managers overseeing >$1T AUM voted that Emerging Markets would be the top performer in 2022. We agree – and are aggressively positioned with one of the top weights in the index – in Alibaba:
So while big sell side firms debate whether the S&P 500 is going to be up 9% or down 5% next year, avoid the noise, look under the surface and find the bargains – wherever they may be domiciled. The end of year selling pressure in laggard names is in the rear view mirror for institutional managers – and nearing its climax for retail tax loss selling:
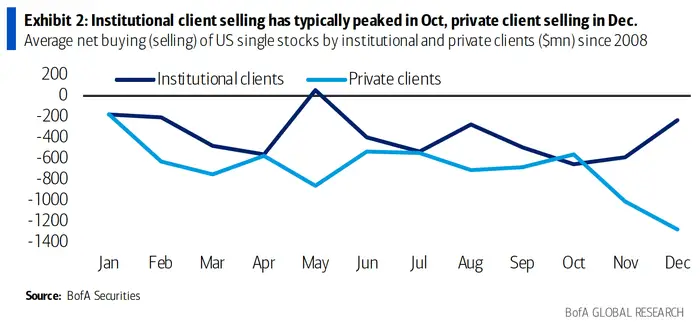
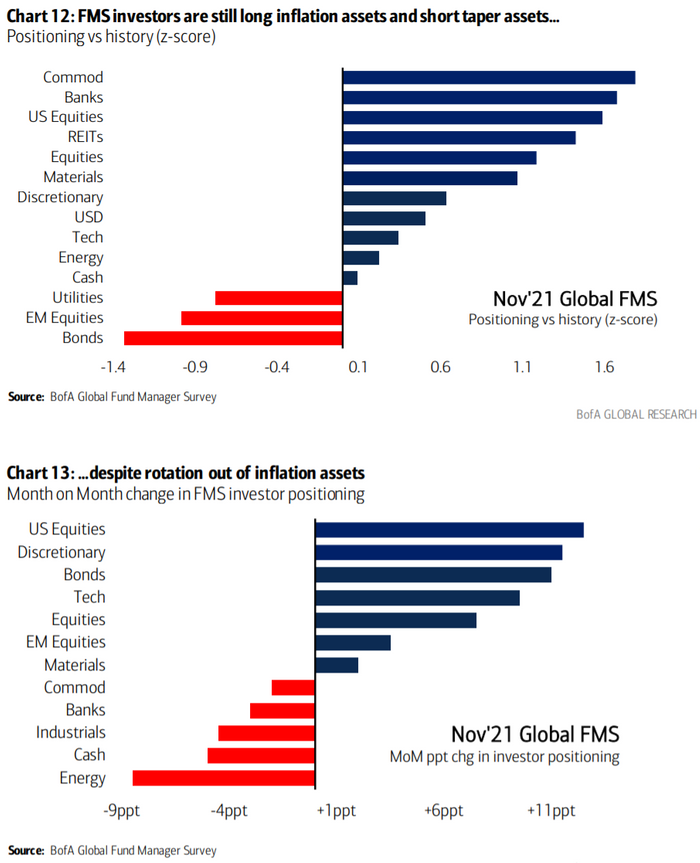
You can see in this month’s fund manager survey that while Institutions are still dramatically underweight Emerging Markets (second only to bonds – see chart 12), they did start to add EM allocation last month (Chart 13). This is in-line with what we see in Exhibit 2 above [they got done selling their laggards in early October (dark blue line)].
So you can attempt to chase Tesla and Rivian “to the moon,” or you can take a different tack and skate to where the puck is going next…
Now onto the shorter term view for the General Market:
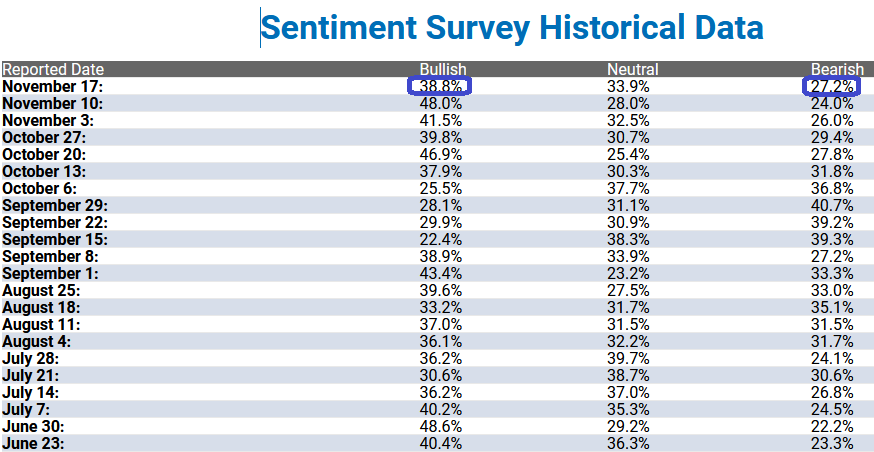
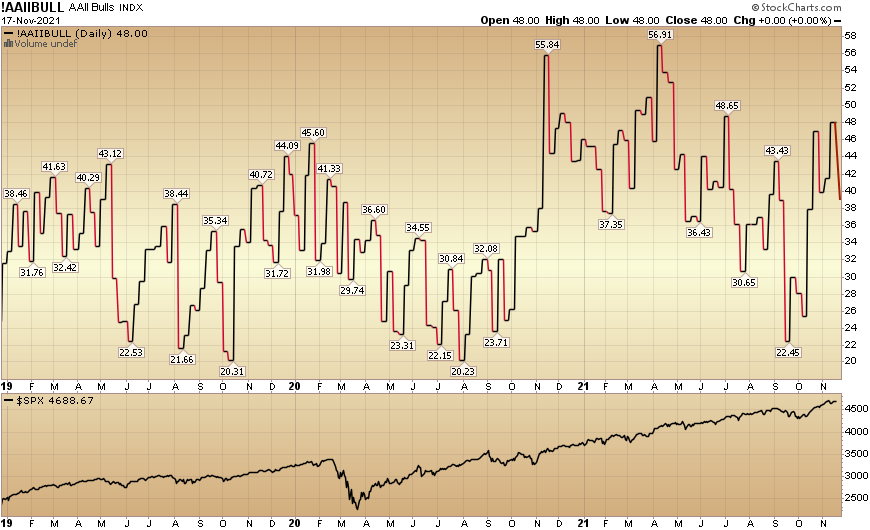
In this week’s AAII Sentiment Survey result, Bullish Percent (Video Explanation) fell to to 38.8% this week from 48% last week. Bearish Percent rose to 27.2% from 24% last week. Retail exuberance is waning.
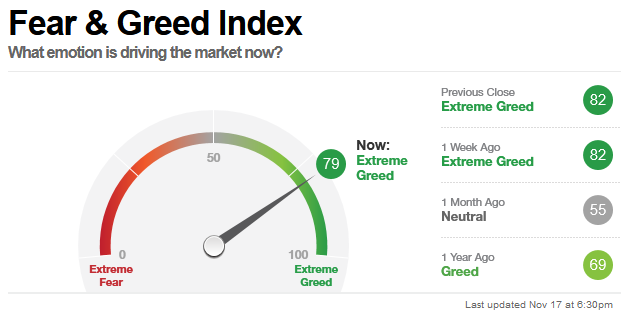
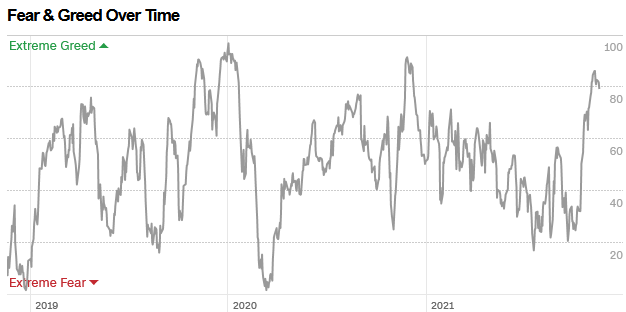
The CNN “Fear and Greed” Index ticked down from 82 last week to 79 this week. Greed is still present. You can cautiously ride existing risk into year end (if you own reasonably valued businesses), but its not a time to add a lot of new risk/high beta at these levels. You can learn how this indicator is calculated and how it works here: (Video Explanation)
And finally, this week the NAAIM (National Association of Active Investment Managers Index) (Video Explanation) ticked down to 103.69% this week from 107.99% equity exposure last week. Managers continue to chase into year end – as they were underweight with the market pressing higher through earnings season.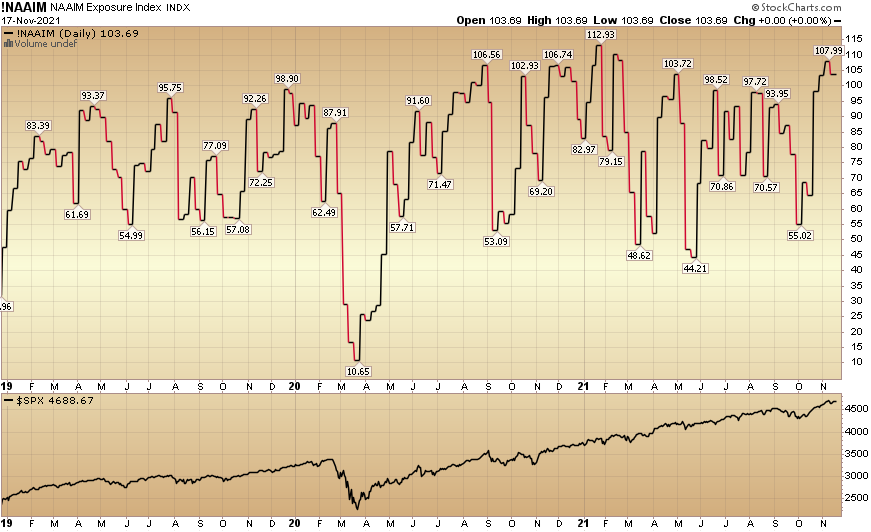
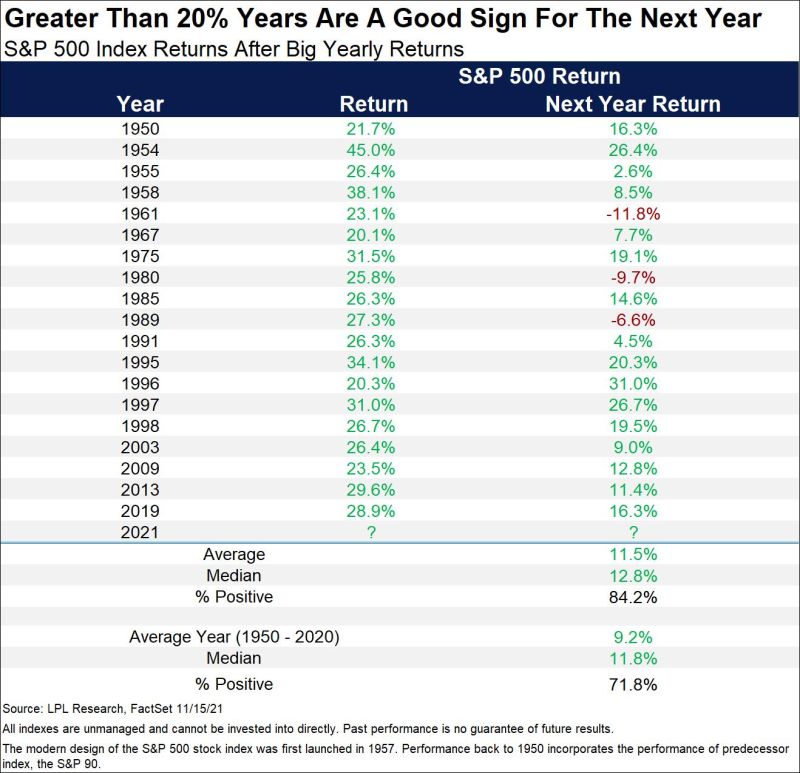
So while I think the S&P will grow high single digits to low double digits in 2022 (with some potholes along the way), it would not surprise me to see 2018 type volatility early on in the year. This return expectation is in-line both with low double digit earnings growth expectations and historic quantitative data provided by LPL (Ryan Detrick) below:
I would not anticipate any major breakdowns through year-end 2021 – barring a major surprise around the Fed OR debt ceiling (both lower probability events – which will likely be contained to a few days of chop). As for the Fed you’re either getting a known Dove or an unknown Super-Dove.
The increased volatility next year will create more opportunity to capture “under the surface” sector rotation/dislocation opportunities – which is our knitting…
In the mean time, we may very well be in for a “Play It Again” year in 2022…

