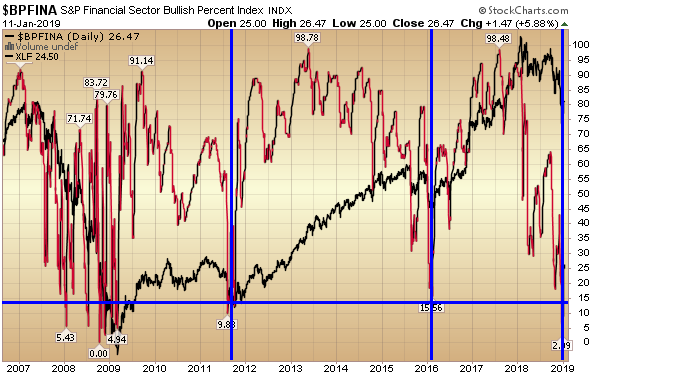
With bank earnings on deck, it’s a good time to take stock of the health of the Financial sector to anticipate possible moves in the sector in coming months. The above chart is the “Bullish Percent Index” for financials (red and black line) with the Financial Sector ETF in the background (all black line).
The Bullish Percent Index, or BPI, is a breadth indicator that shows the percentage of stocks on Point & Figure Buy Signals. There is no ambiguity on P&F charts because a stock is either on a P&F Buy Signal or P&F Sell Signal. The Bullish Percent Index fluctuates between 0% and 100%.
In December, the Bullish Percent for Financials got as low as ~2% (to say extreme is an understatement). Historically (with the exception of 2008), it has been a huge opportunity to buy banks when the indicator dipped below 20. It is currently trading at ~26 going into earnings. As with all indicators, they are a barometer to weight probabilities and not a crystal ball (as black swans like 2008 do happen – albeit infrequently). That’s where risk management becomes paramount. The key is taking probability advantaged trades over a series – with a positive expected outcome and disciplined risk management and sizing to win over time.


