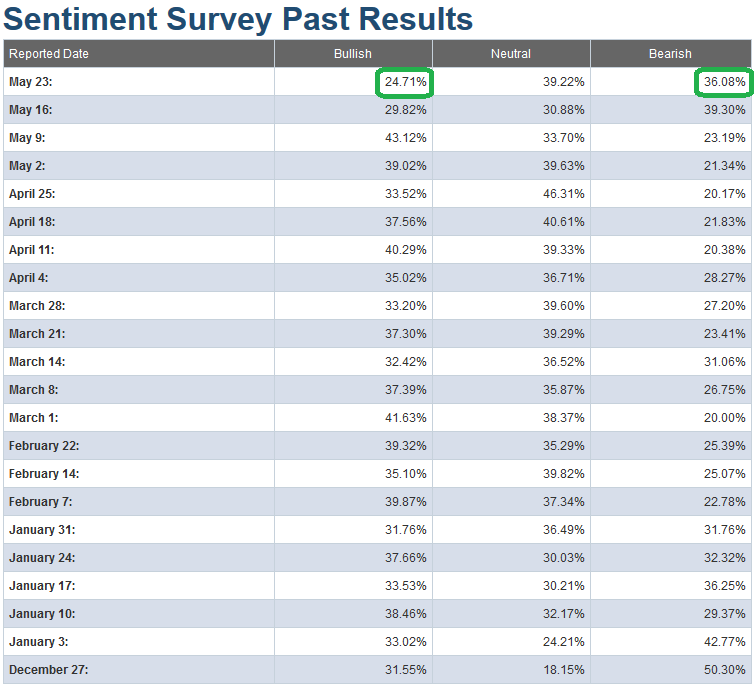
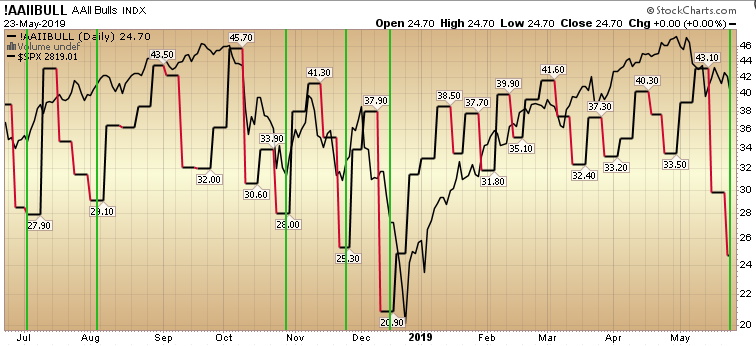
Today’s AAII Sentiment Survey results had the bulls running for the hills! When you look at the chart above, the red and black line represents the bullish percent number from the weekly survey. The black line in the background represents the S&P 500. In those instances where bullish sentiment dropped below 30 and leveled off, it has paid to buy the market. The exception was late December when we had the “glitch” but the market recovered shortly thereafter.

As with all indicators and oscillators, they are simply a barometer, not a crystal ball. Used in concert with other factors they can help you probability weight the advantage/disadvantage of any positioning.


