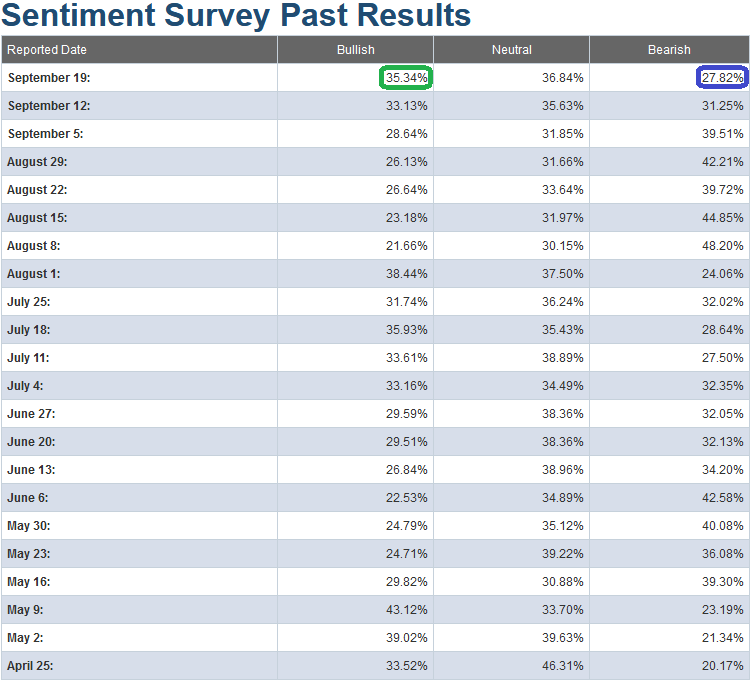
This week, AAII Sentiment Survey results edged up from 33.13% Bullish Percent to 35.34%. Since mid-August we had been suggesting stepping in as buyers of stocks when everyone else was selling and rushing to bonds. You can review our previous sentiment articles here:
https://www.hedgefundtips.com/category/sentiment-indicators/
So what now?
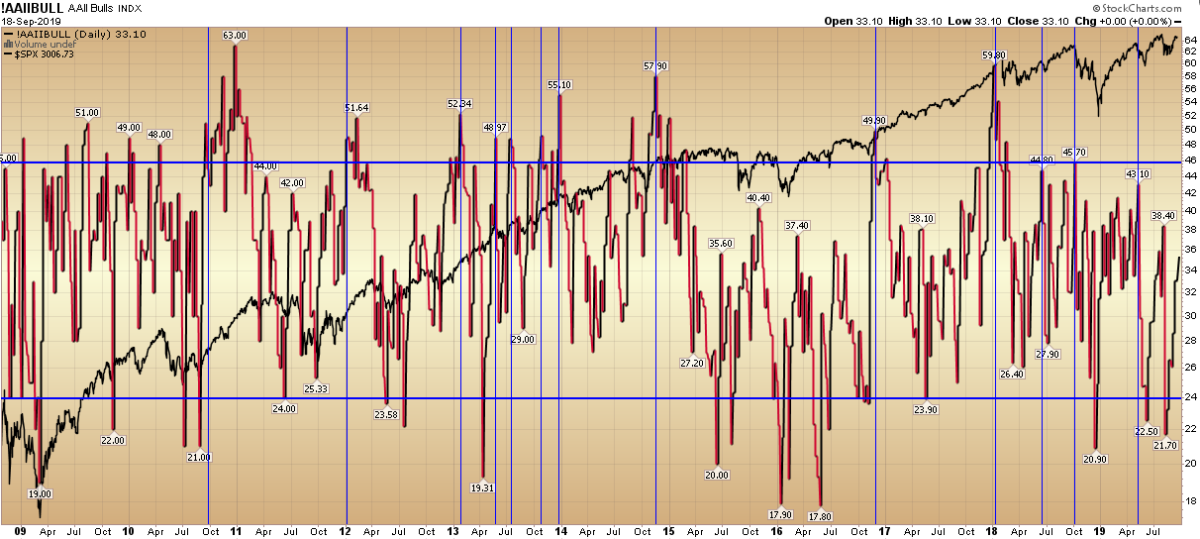
I have blown up this week’s chart (above) – to over ten years – to display AAII Bullish Percent against the S&P 500. The message the data is sending is that it would be unusual (not unprecedented) to see a material pullback before bullish percent ran above 40%. What the long term view also displays is that (although we haven’t seen it in the past year) it is not uncommon to see euphoric levels of bullishness as high as the mid 50’s before the air comes out of the balloon.
Looking at our normal data table below, you would not expect that Bullish Percent could get that high, but looking at the chart above, you can see it is a regular occurrence that precedes peaks. On that measure we are ~66% (2/3) of the way to peak euphoria.
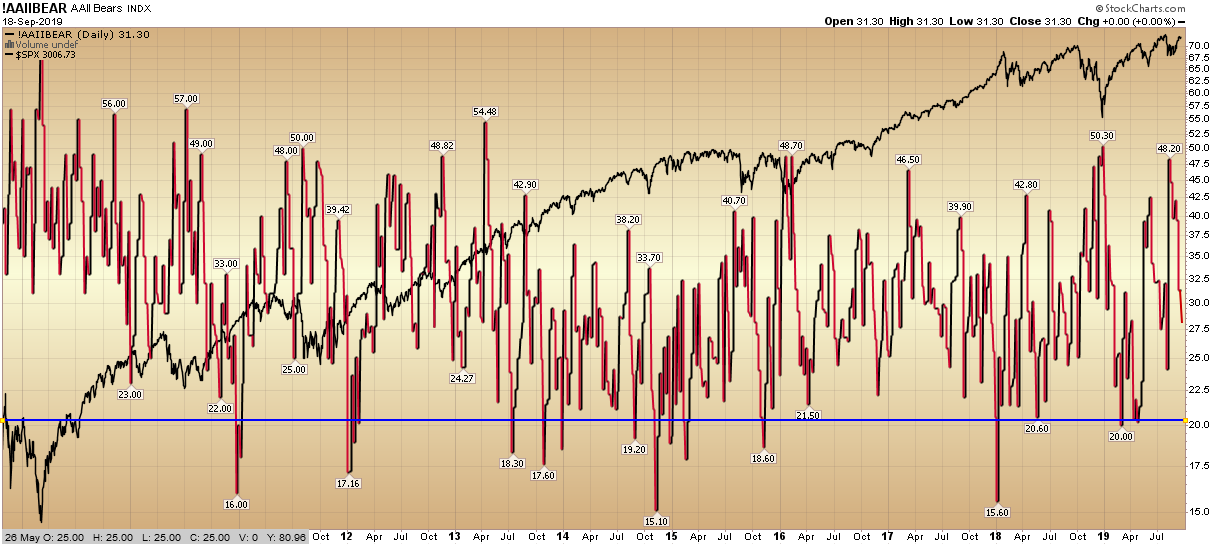
So what about Bearish Percent? That has dropped quite a bit to the high 20’s – which is evidence that complacency is creeping in. However, complacency is a step toward euphoria – not the same neighborhood. Just as the AAII Bullish Percent has a tendency to rise as high as the mid-50’s during eutrophic periods, the Bearish Percent below drops as low as the high teens. Again – we are about 66% of the way there:
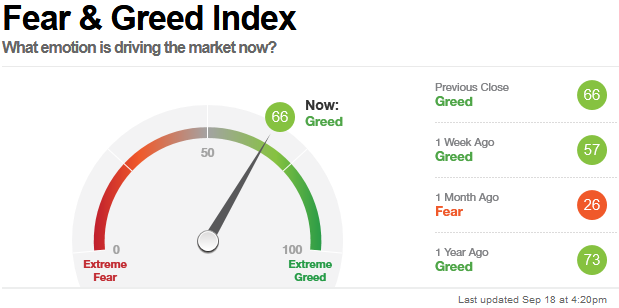
A shorter term indicator we look at to see whether it lines up with our sentiment findings is the CNN Fear and Greed indicator (a compilation of a half dozen standard technical indicators). It is at 66, which is perfectly in line with what sentiment is telling us. Sentiment and F&G have moved up with the market since mid-August (when pessimism was the highest), but they are both around 2/3 of the way to extremes – where we would want to get a lot more cautious.
There used to be a saying “smoke ’em if you got ’em” which meant “this might take a while, so you may want something to keep you occupied while you wait.” I think the appropriate saying to describe where we are right now (as measured by these barometers) is, “if you own ’em hold ’em” as this move could have some more room/time to run. That is not to say there will be no chop, but odds favor moving higher – with sentiment and price – before we would get aggressively cautious. There is more of the wall of worry to climb…
For further analysis, we have published a few dozen “Indicator of the day in 60 seconds or less” videos – which explain numerous other indicators that can be useful in measuring extremes. There is no “magic” indicator (including sentiment) – but when you run a mosaic of a half dozen that have proven accurate historically – and couple it with fundamental data, you skew the odds in your favor, manage the risk, and win more often than you lose. No trader/investor can ask for more than that…
You can find the free videos here:
https://www.hedgefundtips.com/category/market-indicators/