As a supplement to this morning’s commentary on this week’s AAII Sentiment Survey results:
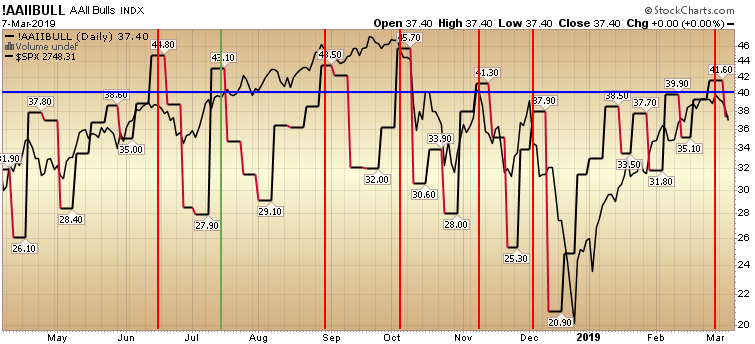
I pulled together this chart (above) that shows its recent efficacy as a barometer for short term turning points.
In 6 out of the past 7 times the Bullishness reading (red/black line in foreground) exceeded 40% (blue horizontal line) we saw a modest to meaningful pullback/correction in the S&P 500 (solid black line in background). The green vertical line depicts the one instance that the market just continued upward despite the extreme in sentiment. It does not mean the accuracy rate will continue, but it does mean it is well worth noting.
If you found this post helpful, please consider visiting a few of our sponsors who have offers that may be relevant to you.


