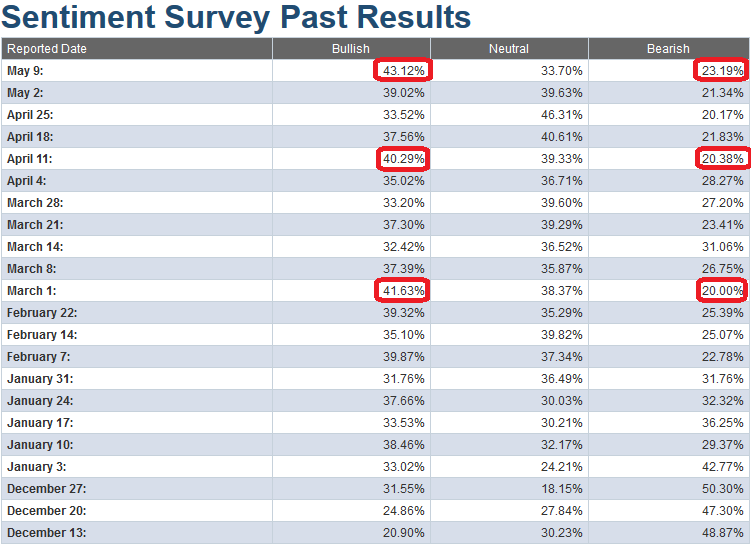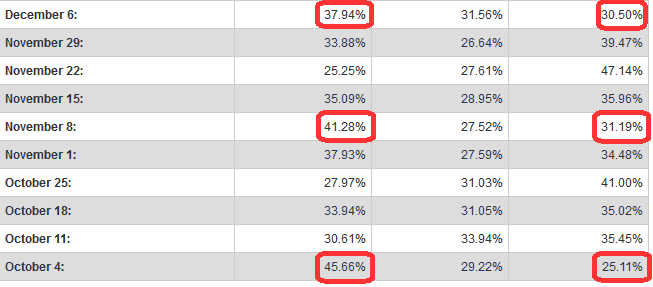

If you had asked me last night where the AAII sentiment Survey results would come in this morning I would have said, “35-37% bullish percent.” Instead we got an extreme read to 43.12%. Bearishness is still near historic lows at 23.19%. This is not the type of read bulls want to see.
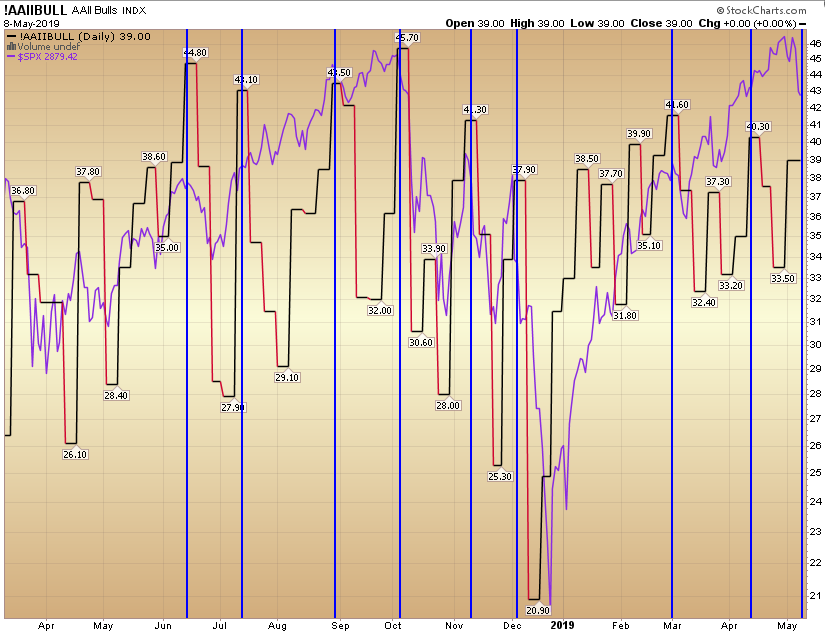
However, let’s take a look at the historic examples and see how the statistics played out in the past year. In the chart above, each blue vertical line represents a week where the “bullish percent” AAII result hit an extreme (above 40). The purple line is the S&P 500, and the red/black line is the AAII sentiment survey result.
June 14, 2018 – 44.80 read -> correction
July 12, 2018 – 43.10 read -> NO CORRECTION (burned through extreme)
August 30, 2018 – 43.50 read -> correction
October 4, 2018 – 45.66 read -> correction
November 8, 2018 – 41.28 read -> correction
March 1, 2019 – 41.63 read – > correction
April 11, 2019 – 40.29 read -> NO CORRECTION (burned through extreme)
May 9, 2019 – 43.12 read -> ???
So in the last 7 instances of an extreme bullish read (>40) from the AAII Sentiment Survey results, 5 of those instances yielded a market pullback/correction and 2 burned right through the extreme (71.42% recent efficacy as an indicator).
What is interesting about this week’s read is that we have a modest pullback going INTO the read – which we have not had in previous instances. The magnitude of the pullback is in line with what we saw after the extreme read on March 1, 2019 and August 30, 2018. So while bears will see this as an opportunity to sell longs and get short, bulls will say, “we already had the pullback.”
My instinct here is in line with what I pointed out last week, which is to stay long selective laggard/defensive names (in healthcare/large biotech/pharma), and stay short a few selected high-beta names as a hedge. As always, no indicator is a perfect crystal ball. They are best used as barometers.


