Wikipedia, “The Noid was an advertising character for Domino’s Pizza created in the 1980s. Clad in a red, skin-tight, rabbit-eared body suit with a black N inscribed in a white circle on his chest, the Noid was a physical manifestation of all the challenges inherent in getting a pizza delivered in 30 minutes or less. Though persistent, his efforts were repeatedly thwarted.”
I chose this theme in the context of how we have positioned in recent weeks – relative to how the market has positioned in relation to the relentless headlines (The Noid/Noise) that have worked overtime to take people out of their stocks at the exact wrong time. In this analogy, the “Noid” is headline noise (wall of worry) while “getting a pizza delivered in 30 minutes of less” is getting the market indices to new highs.
In recent weeks’ notes and podcast|videocast(s) I have repeatedly stated:
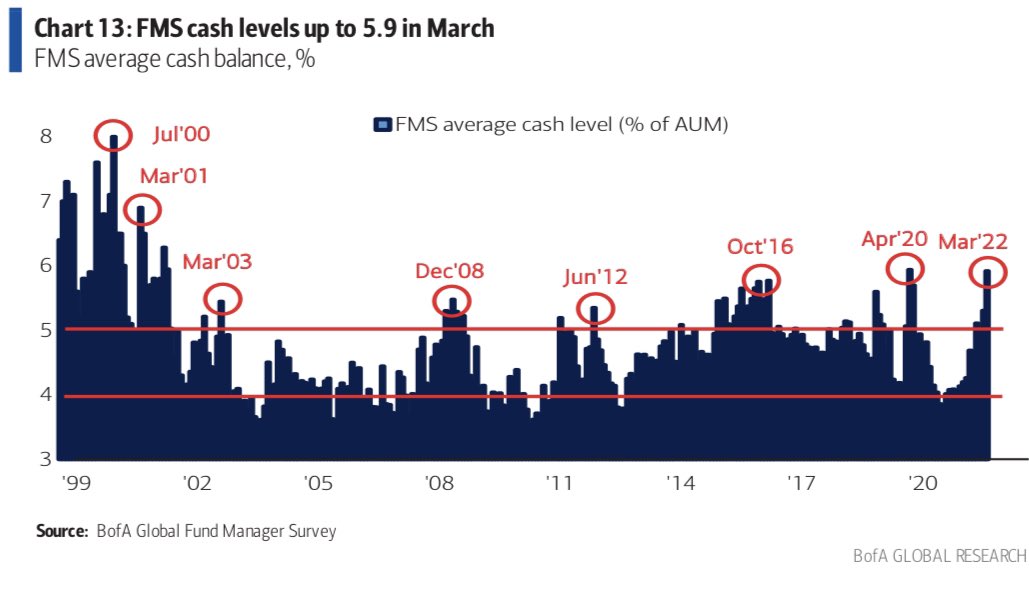
- “The risk in the market is to the UPSIDE, not the downside (based on how people were positioned with high cash levels and puts/shorts/hedges).”
- “Never bet on the end of the world because even if you are right, you won’t get paid.”
- “The time to buy insurance is BEFORE your house is on fire.” Everyone was buying puts, shorting and panicking into cash AFTER the correction (in the hole). This set the stage for one of the biggest 6 day rallies in history.
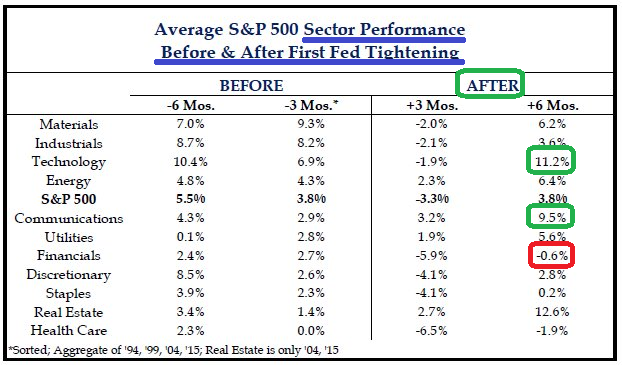
- While everyone is crowding into cyclicals (after they have all doubled and tripled), they are tripping over themselves to dump tech. History shows it pays to take the other side of that trade after the first rate hike (which we had last week):
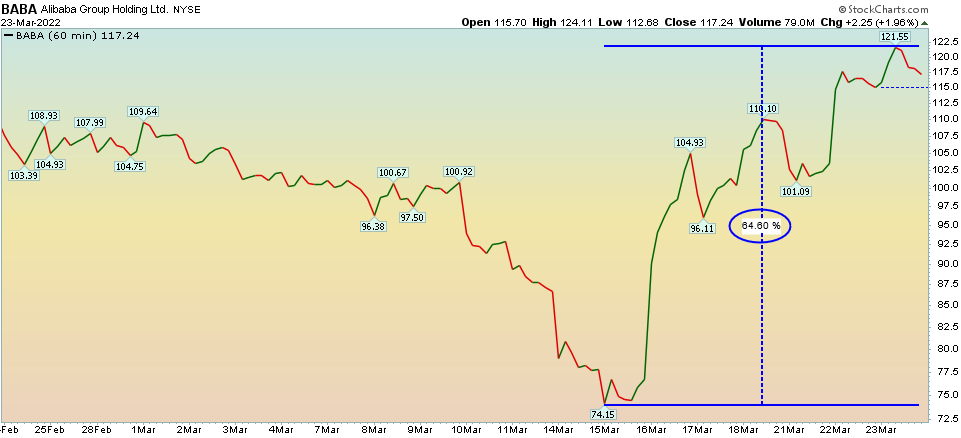
 Here’s what happened to tech, Alibaba and Biotech (our 2 biggest positions) since:
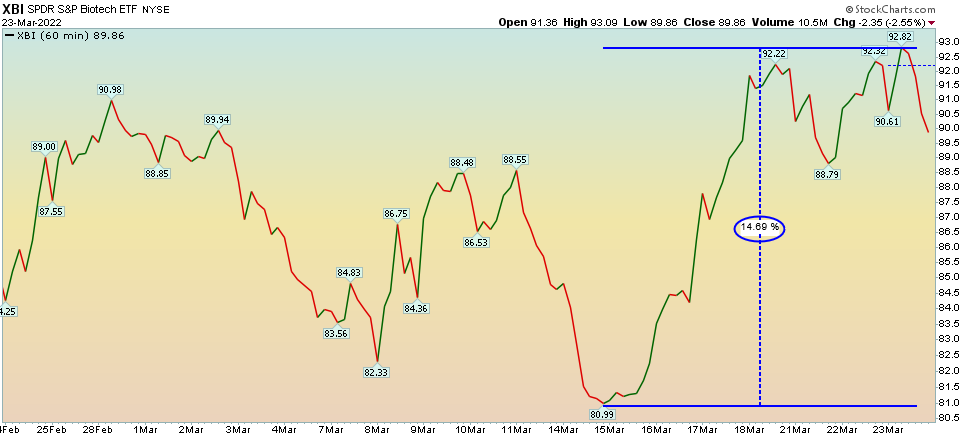
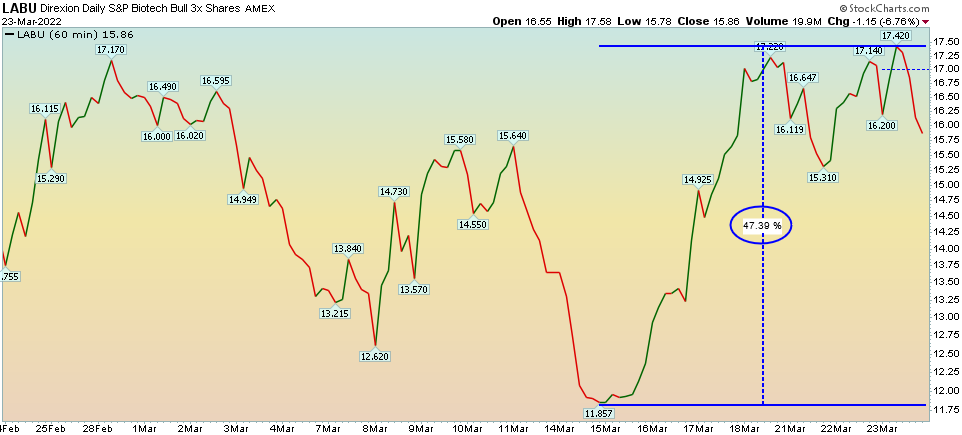 While we should expect a bit of digestion/consolidation following such huge moves (catching most participants offsides), here are some measures we consider regarding whether there’s more gas in the tank for this move (tech, china tech, biotech):


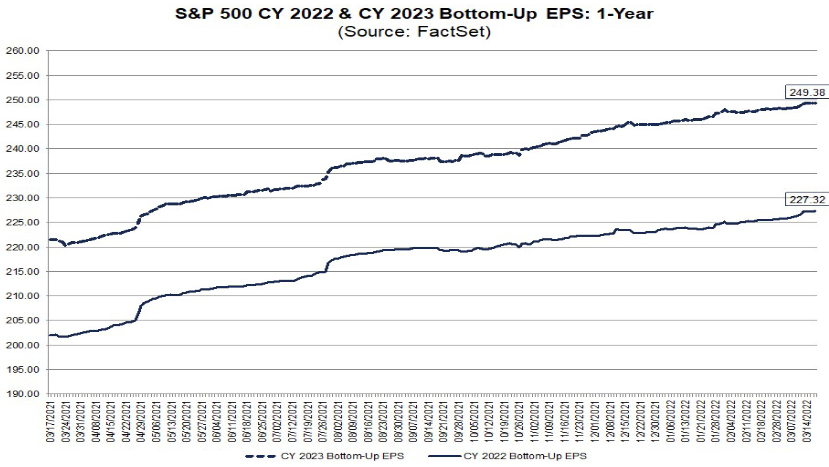
So while everyone is screaming that a recession is coming, the two most important indicators have not confirmed their fears:
1. Earnings estimates continue to CLIMB:
2. The yield curve 2/10 spread has not inverted. If/when that changes, there is historically a 6-18 month lead to the market top. In many cases the inversion has been a BUY signal as the last 6-18 month move (after inversion) is the steepest:
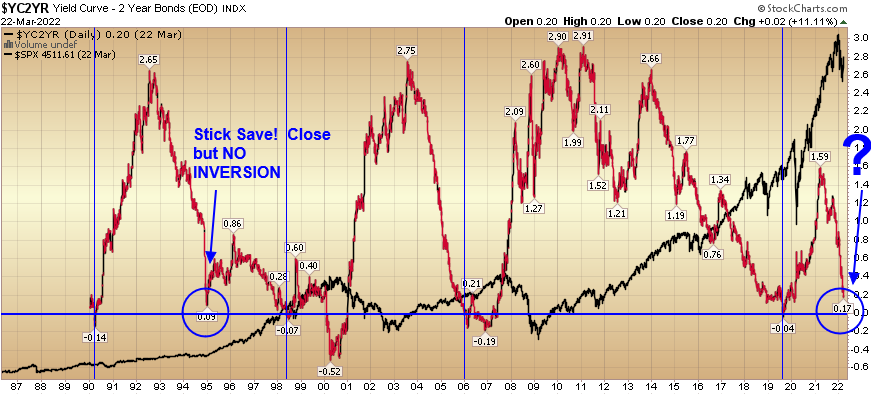
Our base case is they re-steepen the curve with balance sheet roll-off before it actually inverts. If the facts change, we will change our mind – with plenty of time to spare. We don’t have to predict it, rather simply respond to the data.
China
We’ll cover a lot more on China in this week’s podcast|videocast, but for those of you emailing to find out if you “missed it” because Alibaba rallied ~65% off the lows in the last 8 days, know that it’s just the beginning. Over the next 12-24 months we believe there’s a ton of gas in the tank for China Tech that got “left for dead” and labelled “un-investable” by the majority of commentators/analysts in recent weeks. 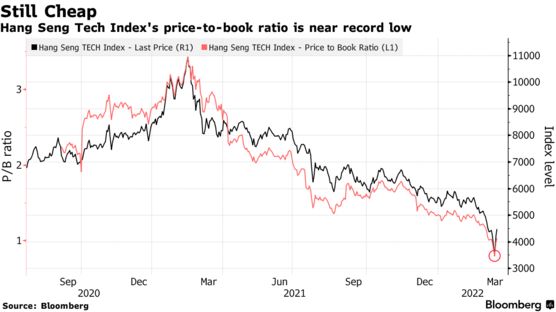
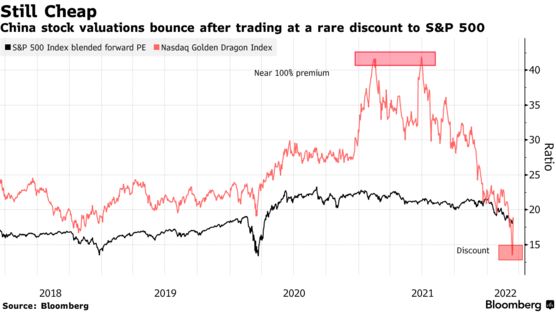 A core part of our thesis has consistently been that the Hang Seng (home of big China Tech) has only traded at a discount to book value several times in history. Only AFTER this big move in recent days are we trading modestly above book value. We will consider the “froth” discussion when the index trades back up to 2-3x book. Here’s what happened next:
“History doesn’t repeat itself, but it often rhymes.”
The last few times Hong Kong was trading below book value, sharp rebounds followed. $BABA
More of this in my @MoneyShow presentation: https://t.co/xaLBwDWP4o pic.twitter.com/nmXW1K0hGR
— Thomas J. Hayes (@HedgeFundTips) March 11, 2022
Now onto the shorter term view for the General Market:
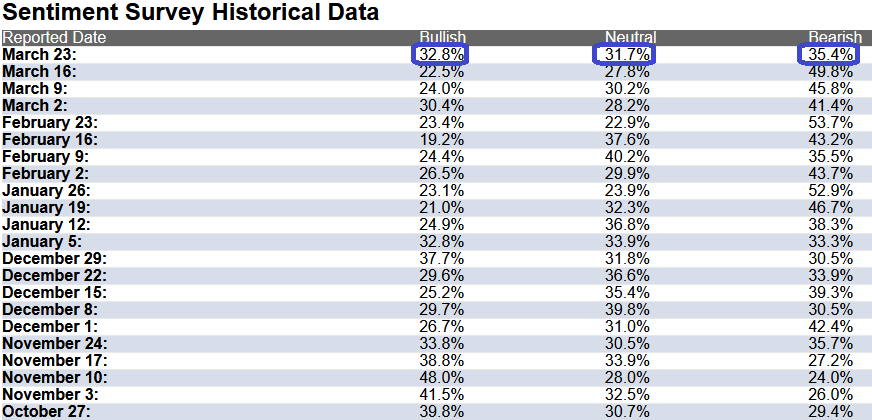
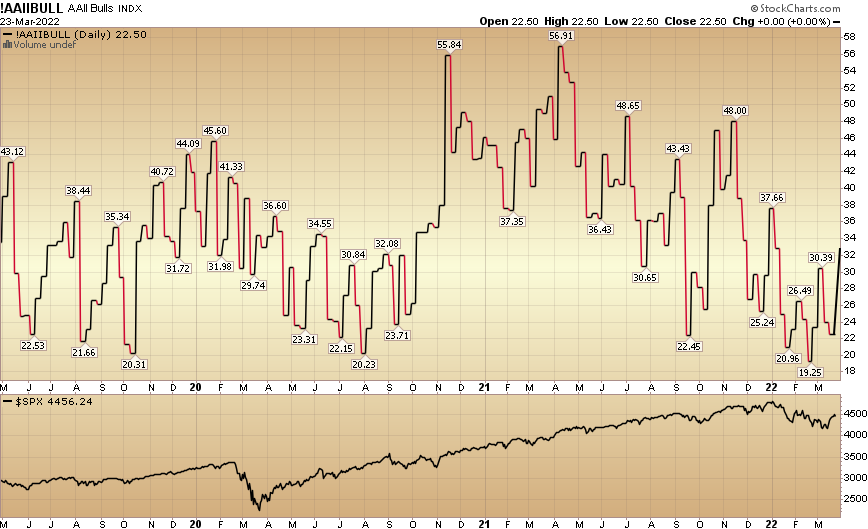
In this week’s AAII Sentiment Survey result, Bullish Percent (Video Explanation) rose to 32.8% this week from 22.5% last week. Bearish Percent fell to 35.4% from 49.8%. After last week’s historic rally, Retail trader/investor sentiment has thawed back to neutral levels. Opinion follows trend…
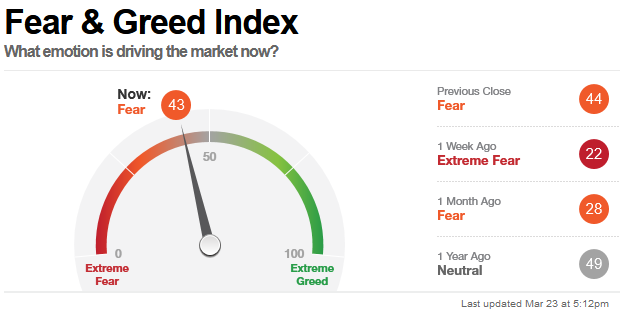
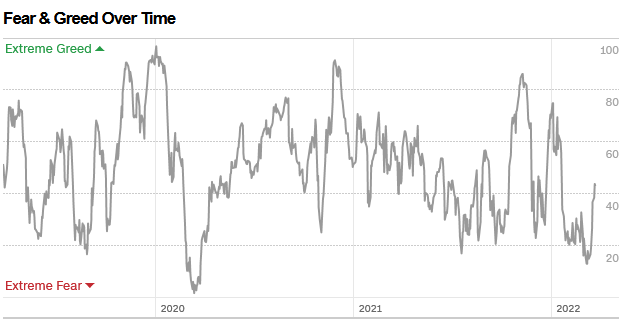
The CNN “Fear and Greed” Index rose from 22 last week to 43 this week. Despite the monster rally off the lows in the past week, fear is still in the market. You can learn how this indicator is calculated and how it works here: (Video Explanation)
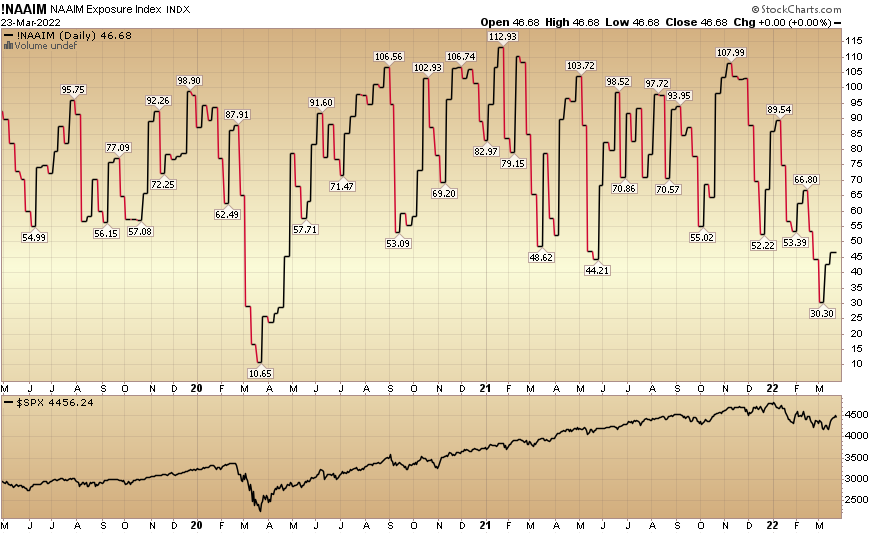
 And finally, this week the NAAIM (National Association of Active Investment Managers Index) (Video Explanation) moved up to 46.68% this week from 42.50% equity exposure last week. Managers still have among their lowest exposures to equities since the 2020 pandemic lows. Managers will have to chase further strength in coming weeks.
Our podcast podcast|videocast will be out tonight or tomorrow. Each week, we have a segment called “Ask Me Anything (AMA)” where we answer questions sent in by our audience. If you have a question for this week’s episode, please send it in at the contact form here.


