On Wednesday afternoon (after the Fed Minutes were released), I joined Liz Claman on Fox Business – The Claman Countdown – to discuss the Stock Market, the Fed, and Russia. Thanks to Liz and Ellie Terrett for having me on:
Here were my show notes:
Biggest market threat to the market is a policy misstep – using Fed Funds rate too quickly (50bps) and under-utilizing balance sheet rolloff.
-With ~6 hikes already priced in at the short end of the curve the primary event that could derail this recovery is an inversion of the yield curve (2/10 Treasury spread). The spread has gone from ~1.6% last March to ~.50bps today. An inversion would choke off lending incentives for banks and cause a recession.

One key way to save the flattening (start re-steepening) will be to start to roll off the balance sheet and keep the 10yr yield above 2% – by putting (long-end) supply on the market. Much of the supply will be absorbed by Foreign Demand (10yr above 2%) with the carry trade (borrow in yen and buy Treasuries). The market didn’t like that thought in the January 5th Fed minutes release (and sold off precipitously in Jan following the release). As the curve flattens, market participants are now opening up to the idea of QT OVER aggressive hikes. This is reflected in the Fed Minutes that were released on Wednesday:
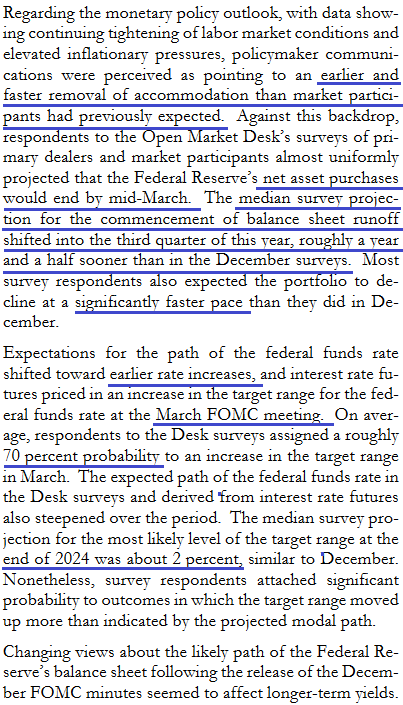
“While participants agreed that details on the timing and pace of balance sheet runoff would be determined at upcoming meetings, participants generally noted that current economic and financial conditions would likely warrant a faster pace of balance sheet runoff than during the period of balance sheet re-duction from 2017 to 2019. Participants observed that, in light of the current high level of the Federal Reserve’s securities holdings, a significant reduction in the size of the balance sheet would likely be appropriate.”
Odds of a hot war in Ukraine have diminished in past 48 hours. Now we wait for troop withdrawal.
-Albeit a much different scenario, for context, the S&P 500 was up 13.69% in 2014 despite Russia Annexing Crimea in February and March of that year (also under President Biden’s watch as VP under Obama).
Positioning:
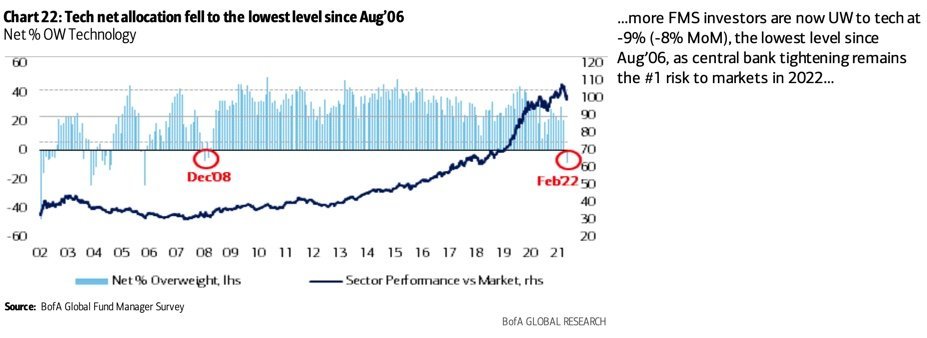
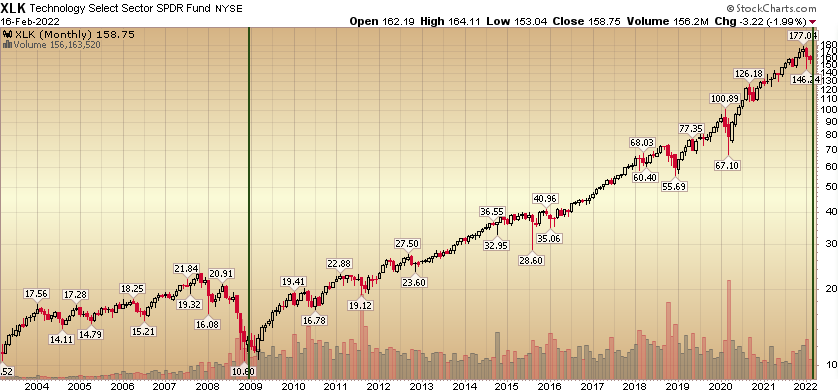
B of A Global Fund Manager Survey showed managers are now -9% underweight tech (lowest since December 2008). They now have their highest overweight to cyclicals in history. Problem is, the time to buy cyclicals was 2020. As GDP moves from 6% last year to 4% this year and back to long-term trend next year – money will flow back into sectors that can grow in a slowing environment.
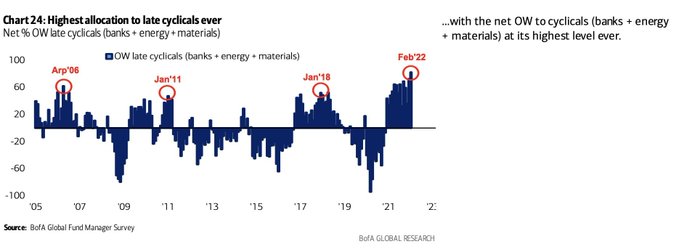
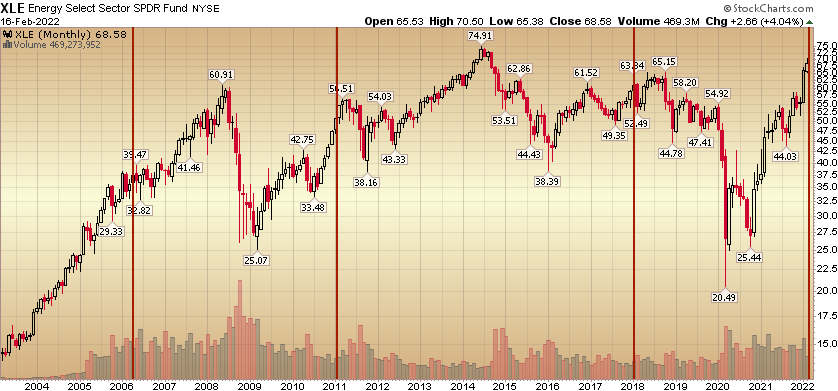
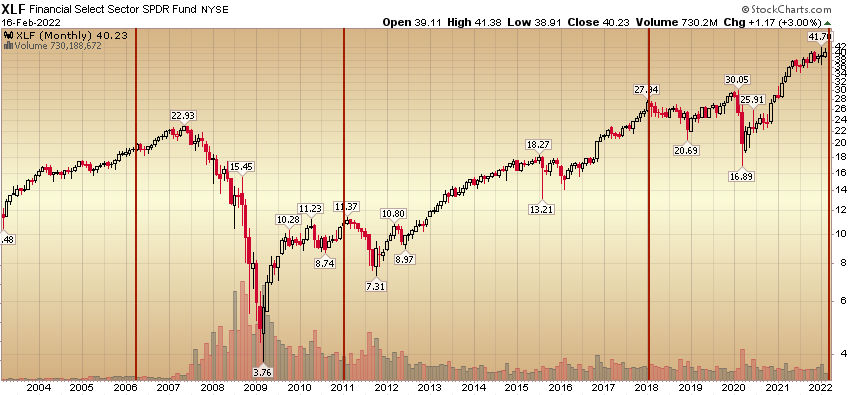
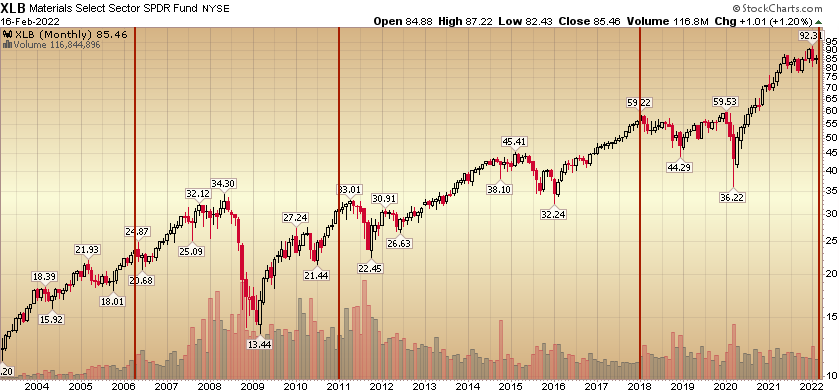
The last 3x managers were this overweight Cyclicals (banks + energy + materials), marked short term tops for the group in Jan 2018, Jan 2011, and mid 2006. Energy may run a bit more until Russia is resolved, but when you look out a couple of months you may find the trap has door opened and let out all of the “Johnny Come Latelies.”
Start to nibble at reasonably valued (not high P/S) Tech/Biotech. For the Biotech sector, just to get back to their average multiples since 1986 the group would have to appreciate:
24% – to get back to average Price to Book multiple.
155% – to get back to average Price to Operating Cash Flow multiple.
112% – to get back to average Forward P/E multiple.
Remember: recovery rallies never stop at their “average.” Just as they overshoot in pessimism on the downside, they overextend in euphoria on the upside.
________________________________________________
History Helps…
From Strategas (via Jessica Menton Bloomberg): “… it has paid investors to maintain a cyclical bias leading up to the first hike. However, the performance in the three months following that hike has struggled.”
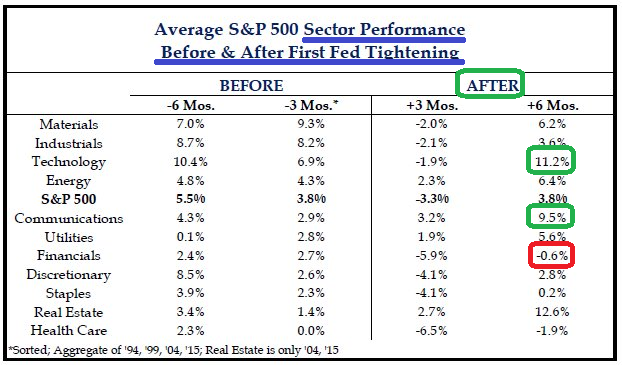
In 3 out of 4 (75%) of the last rising rate environments TECH was the top performing sector.
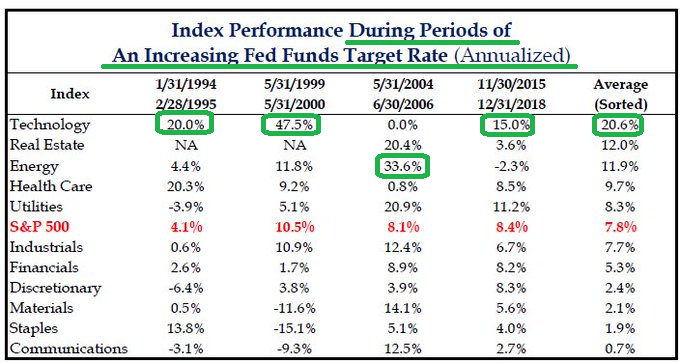
*This is not what the majority of market participants are expecting OR positioned for.
As I’ve said many times, the time to buy insurance is BEFORE your house is on fire! We were buying banks and energy in fall 2020 in ANTICIPATION of rising growth, rates and inflation. Now, in anticipation of moderating growth (GDP ~6% 2021, ~4% 2022, back to trend in 2023), we are buying those sectors which can grow in the face of a slowing environment: Namely Biotech (Sector) and China Tech (Alibaba). We want to skate to where the puck is going versus looking in the rear view mirror.
On Wednesday, Charlie Munger hosted the annual meeting for the Daily Journal. He explained why he doubled down on his double down on Alibaba in Q4 (and used margin debt to increase his position):
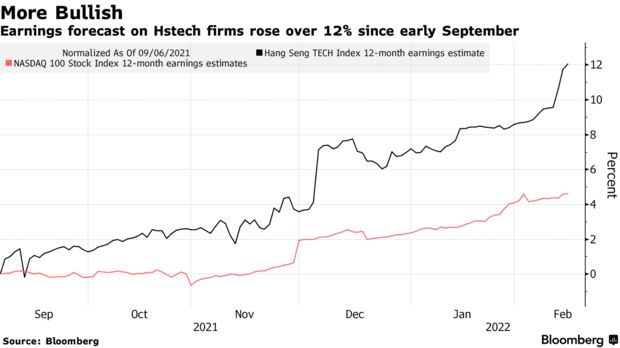
On Thursday, I joined Paul Gray of The Capital Allocators Roundtable to discuss markets, inflation, banks, Biotech and China Tech (BABA). Thanks to Paul for having me on. You can view it here:
________________________________________________
More on Sentiment
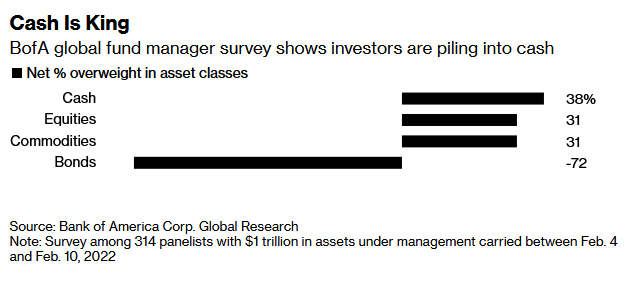
On Tuesday I published a Summary of Bank of America’s Global Fund Manager survey (which interviewed ~300 managers with ~$1T AUM):
February 2022 Bank of America Global Fund Manager Survey Results (Summary)
There were three key takeaways:
- When banks and energy were in the gutter in Fall of 2020, no one wanted them. Now that they’ve all doubled and tripled managers are tripping over themselves to get exposure. We are helping them out by lightening up our exposure (into strength in recent weeks). We would consider reloading for a longer term move on a material pullback in the sectors later in the year.
- Managers can’t get out of Tech and Bonds fast enough. Opportunities in selective parts of these groups will resume in coming months.
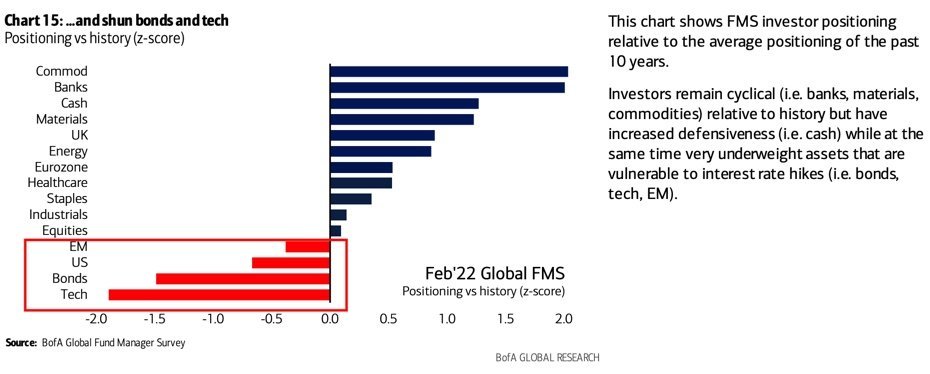
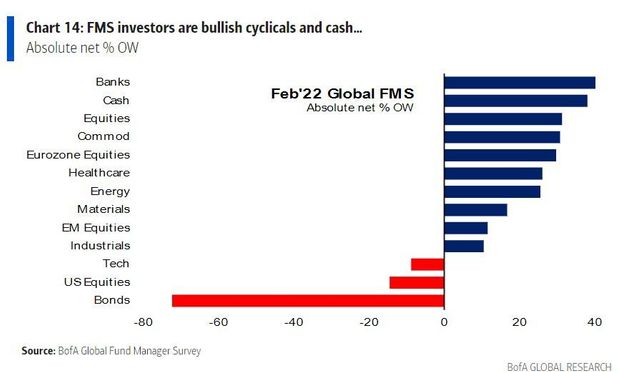
3. Managers are holding more cash than normal. As the market recovers, they will have to chase:
Pillars For The Market
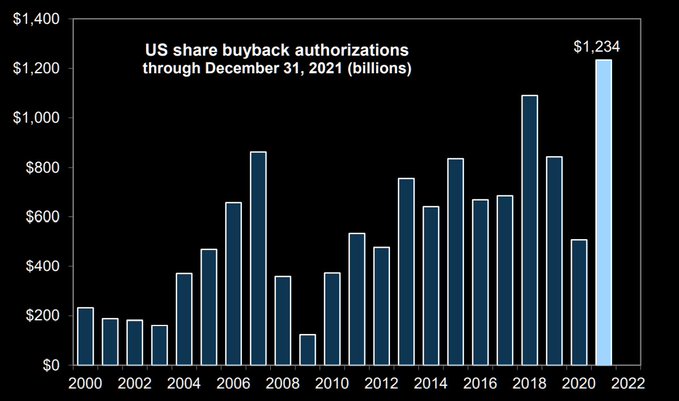
1. Buybacks: $1.234T authorized for 2022 so far:
(source: Gianluca)
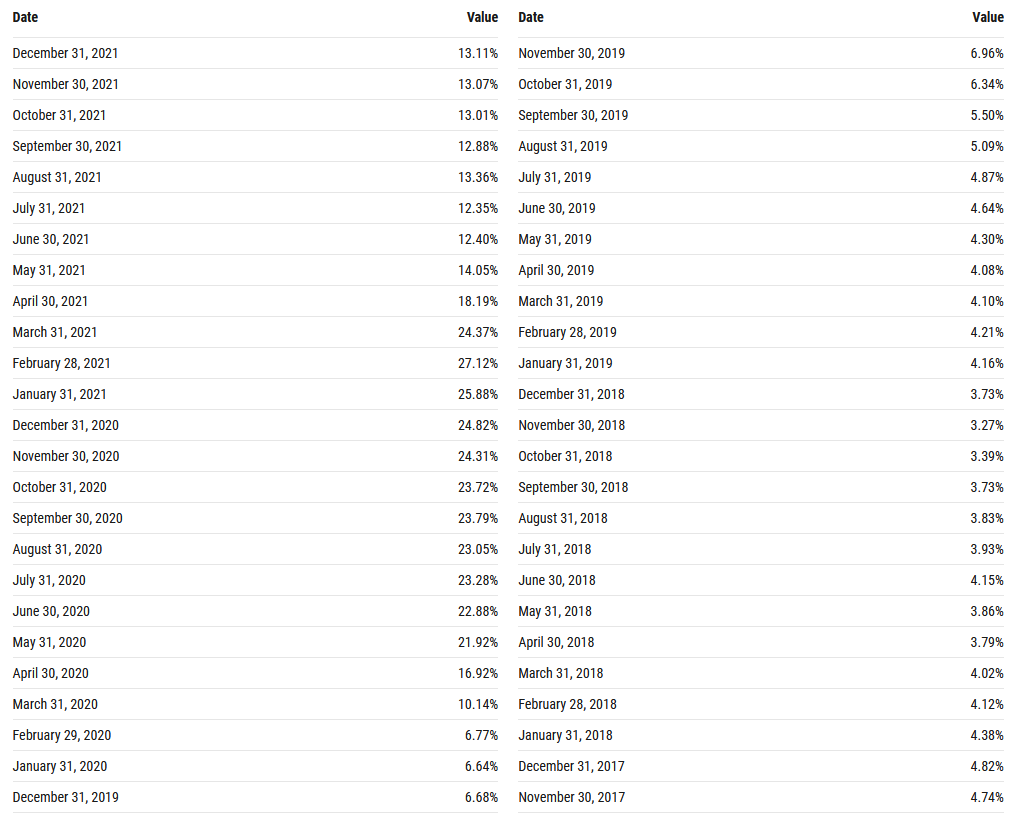
2. Money Supply/Liquidity Still Growing (but slowing rate of change will help inflation moderation on a lagged basis):
M2 Growth:
3. Tightening shows up on a LAGGED BASIS (will moderate inflation). Tightening BEGAN a year ago: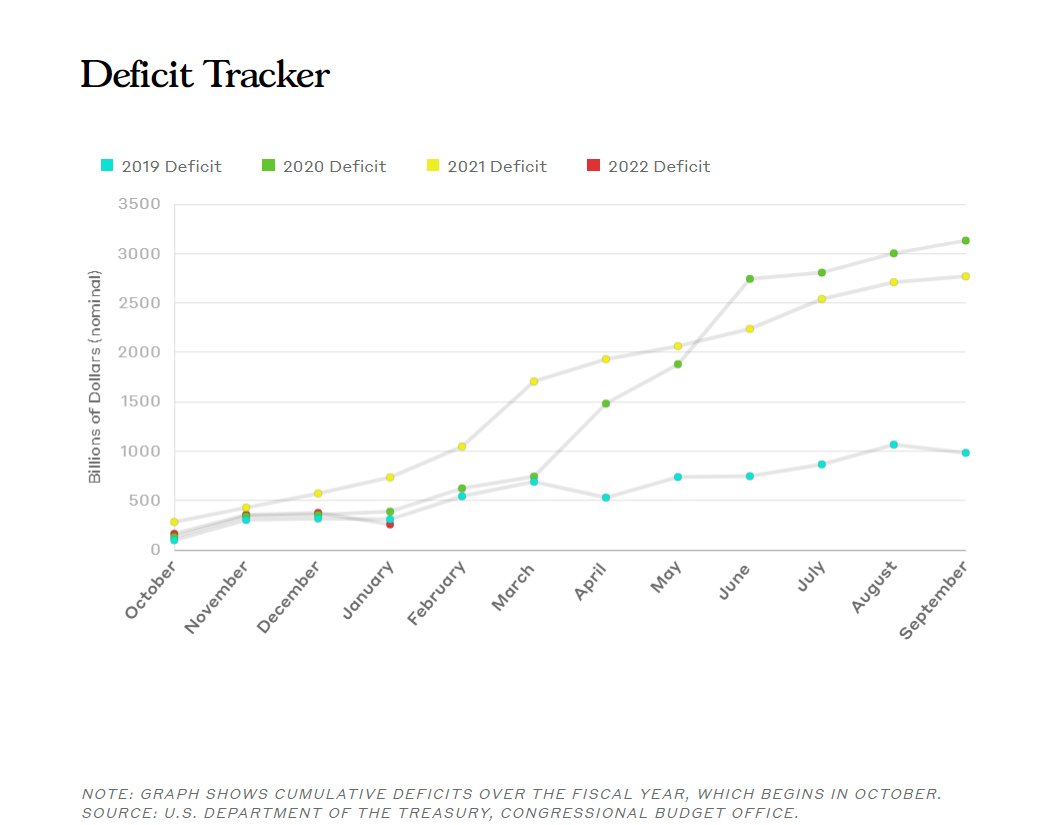
(image source: S.A. Saifan)
- Federal Deficit has come down from 18.5% to 9.5%.
- 2/10 spread narrowed by 110bps (reduces incentive to lend).
- M2 Money Supply growth peaked in February 2021.
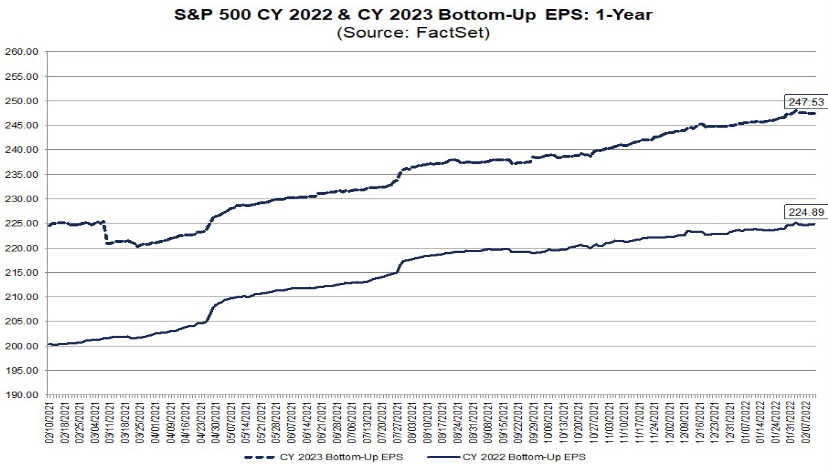
4. Earnings are still RISING: $224.89 2022 est. $247.53 2023 est.
5. The 10-yr treasury yield has been below 3% twenty percent of the time post WWII. In those periods, the market’s performance is 2x as good as when it is above 3%.
6. Consumer Confidence has only been this low 3% of the time post WWII. Despite this fact, Retail Sales surged in January and JP Morgan Chase Credit Card data (up 8% and continuing in February) was the highest in a decade. As consumer sentiment and inflation are joined at the hip, we expect the consumer to improve even more as inflation begins to moderate in coming months.
Now onto the shorter term view for the General Market:
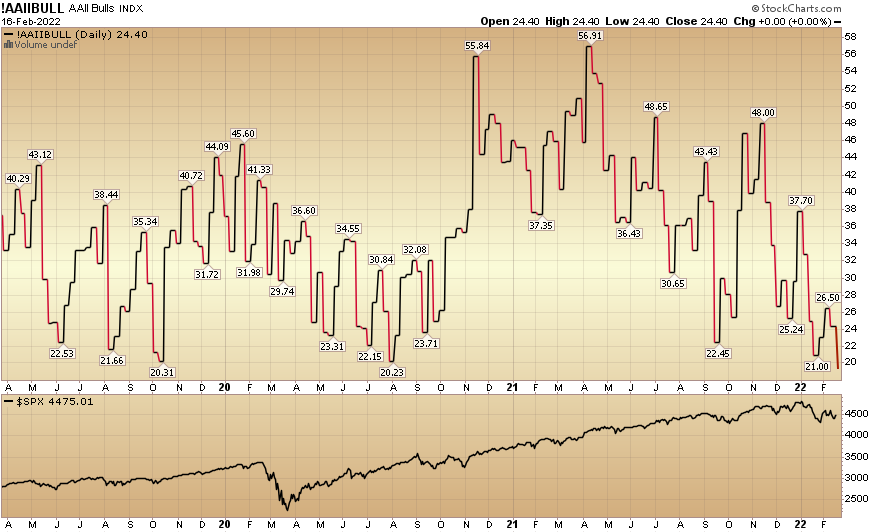
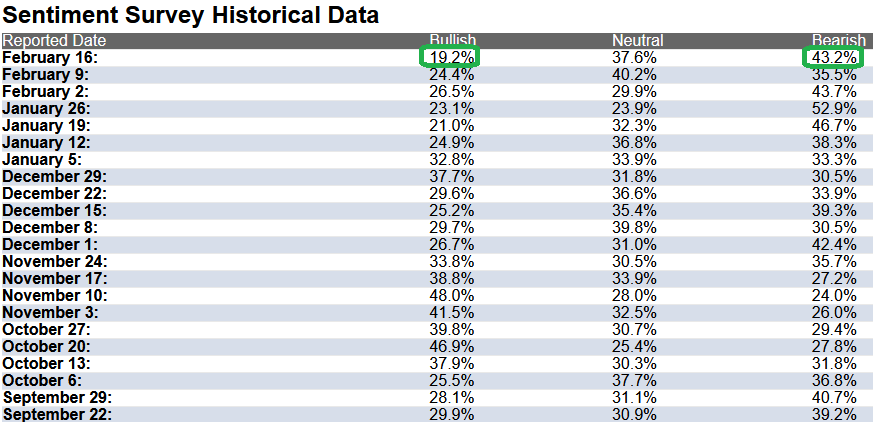
In this week’s AAII Sentiment Survey result, Bullish Percent (Video Explanation) ticked down to 19.2% this week from 24.4% last week. Bearish Percent rose to 43.2% from 35.5%. Retail trader/investor sentiment is at its lowest level since the 2015/2016 lows.
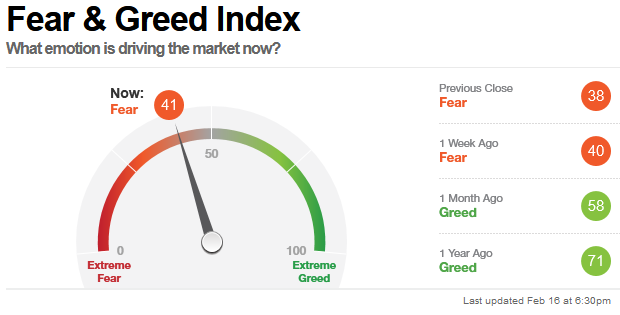
The CNN “Fear and Greed” Index inched up from 40 last week to 41 this week. There is still fear in the market. You can learn how this indicator is calculated and how it works here: (Video Explanation)

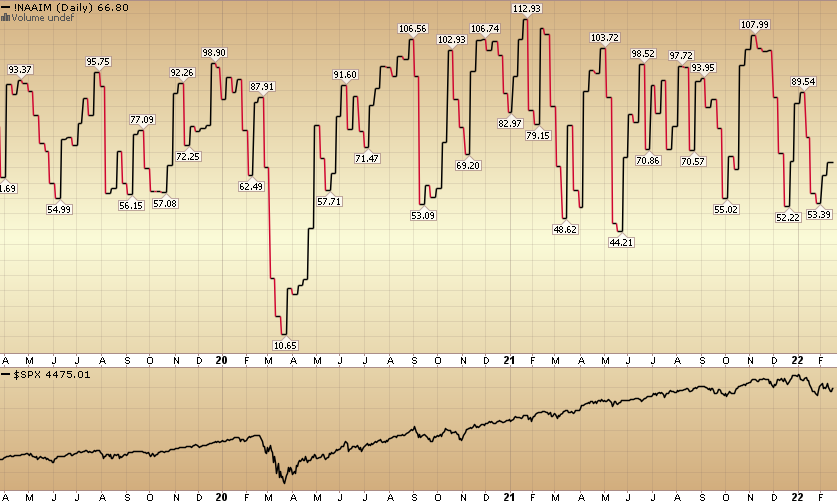
And finally, this week the NAAIM (National Association of Active Investment Managers Index) (Video Explanation) rose to 66.80% this week from 62.54% equity exposure last week. Managers will have to chase any strength in coming weeks.
Our podcast podcast|videocast will be out tonight. We have a segment each week called “Ask Me Anything (AMA)” where we answer questions sent in by our audience. If you have a question for this week’s episode, please send it in at the contact form above.


