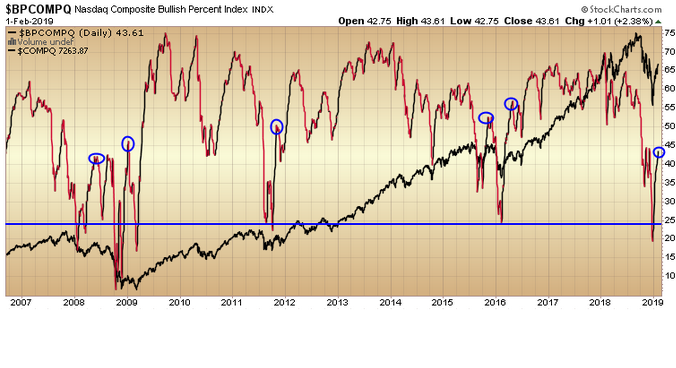
Right now, the “Bullish Percent” Nasdaq composite index is coming in at just 43.61%. The above chart is the “Bullish Percent Index” for the Nasdaq Composite (red and black line) with the Nasdaq Composite Index in the background (all black line).
The Bullish Percent Index, or BPI, is a breadth indicator that shows the percentage of stocks on Point & Figure Buy Signals. There is no ambiguity on P&F charts because a stock is either on a P&F Buy Signal or P&F Sell Signal. The Bullish Percent Index fluctuates between 0% and 100%.
In December, the Bullish Percent for Nasdaq Composite got below 20%. Historically (with the exception of 2008), it has paid off big time to buy a dip in this reading below 30. It is currently trading at ~43.61. It does not have to go straight up – as a consolidation/partial pullback is a possibility (and likely based on the previous first moves off the lows – see blue circles) – but it is saying there is big room to the upside over time.
As with all indicators, they are a barometer to weight probabilities and not a crystal ball (as black swans like 2008 do happen – albeit infrequently). That’s where risk management becomes paramount. The key is taking probability advantaged trades over a series – with a positive expected outcome – and disciplined risk management and sizing to win over time.
If you found this post helpful, please consider visiting a few of our sponsors who have offers that may be relevant to you.


