
Our Applied Stock Market Indicator of the Day (in 60 Seconds or Less) is:
Category: Market Indicators (video)
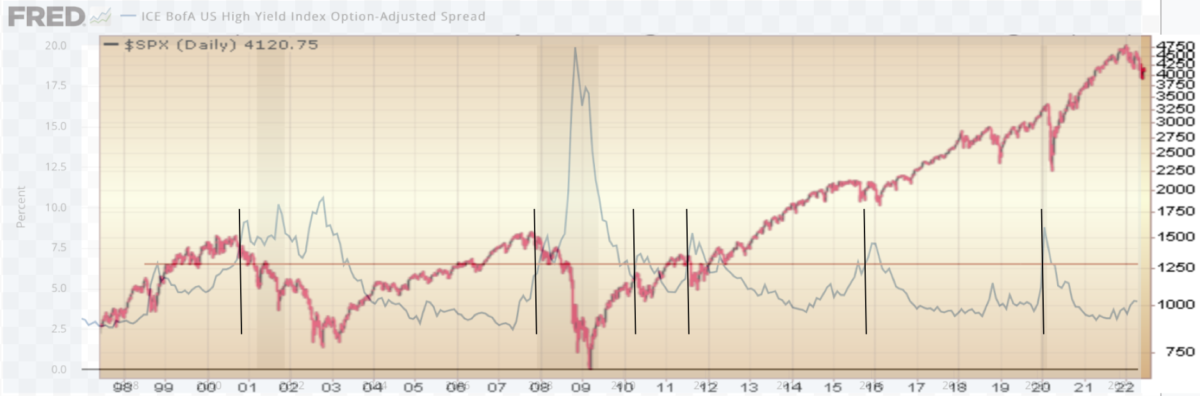
Indicator of the Day (video): High yield Index Adjusted Spread
Our Applied Stock Market Indicator of the Day (in 60 Seconds or Less) is:
High yield Index Adjusted Spread
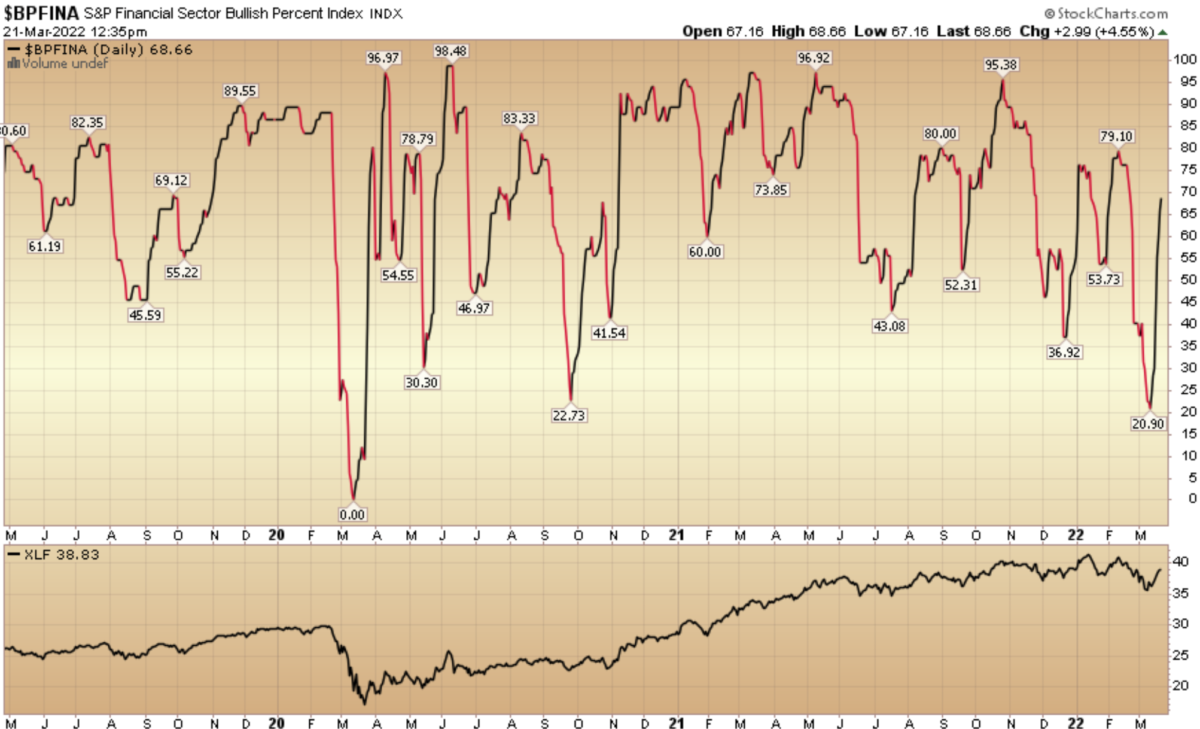
Indicator of the Day (video): Bullish Percent Financials
Our Applied Stock Market Indicator of the Day (in 60 Seconds or Less) is:
Bullish Percent Financials
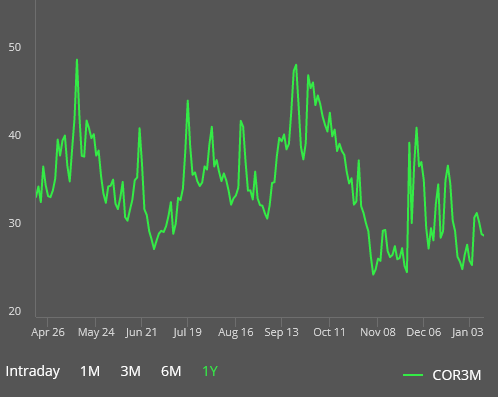
Indicator of the Day (video): Cboe S&P 500 Implied Correlation Index
Our Applied Stock Market Indicator of the Day is:
Cboe S&P 500 Implied Correlation Index
Indicator of the Day (video): Commitments of Traders S&P 500
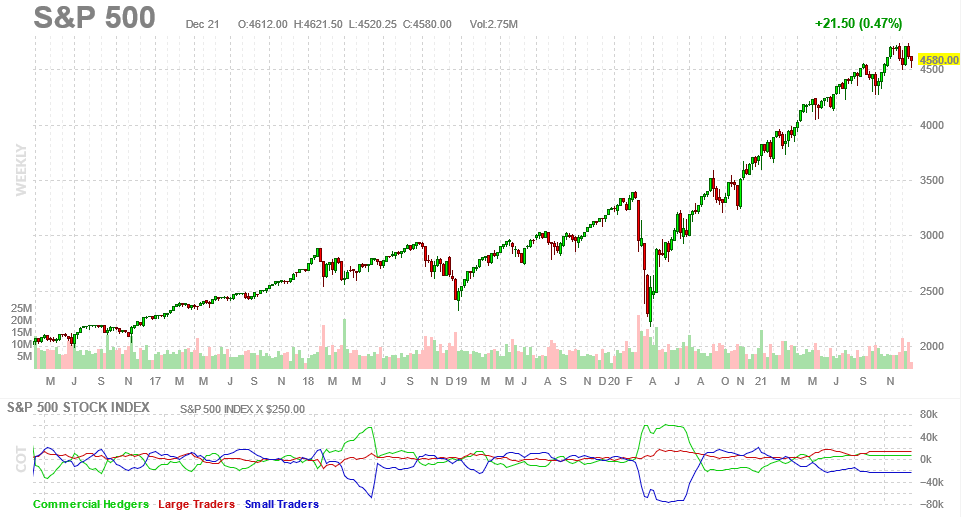
Our Applied Stock Market Indicator of the Day (in 60 Seconds or Less) is:
Commitments of Traders Report S&P 500
Indicator of the Day (video): CNN Fear & Greed Index
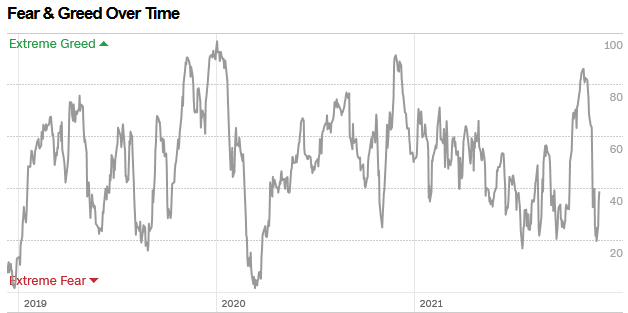
Our Applied Stock Market Indicator of the Day (in 60 Seconds or Less) is:
CNN Fear and Greed Index
Indicator of the Day (video): NYSE TICK
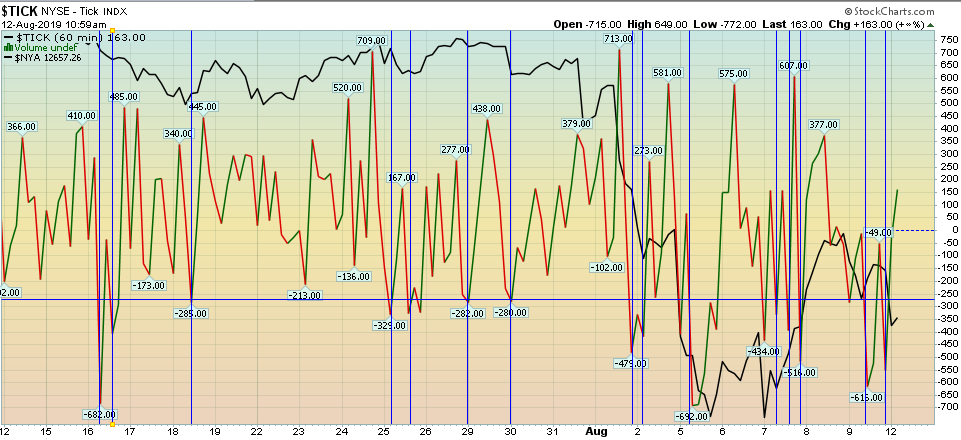
Our Applied Stock Market Indicator of the Day (in 60 Seconds or Less) is:
NYSE TICK ($TICK)
Indicator of the Day (video): Yield Curve Inversion
Our Applied Stock Market Indicator of the Day (in 60 Seconds or Less) is:
Yield Curve Inversion
What would you do here?
If you had to use this one indicator to make a buy or sell decision on the market Monday, what would you do?
Vote and see poll results here:
If you had to use this one indicator to make a buy or sell decision on the market Monday, what would you do? Click to see chart of indicator: https://t.co/z1Qz4EaEU1
— T.J. Hayes (@HedgeFundTips) June 1, 2019
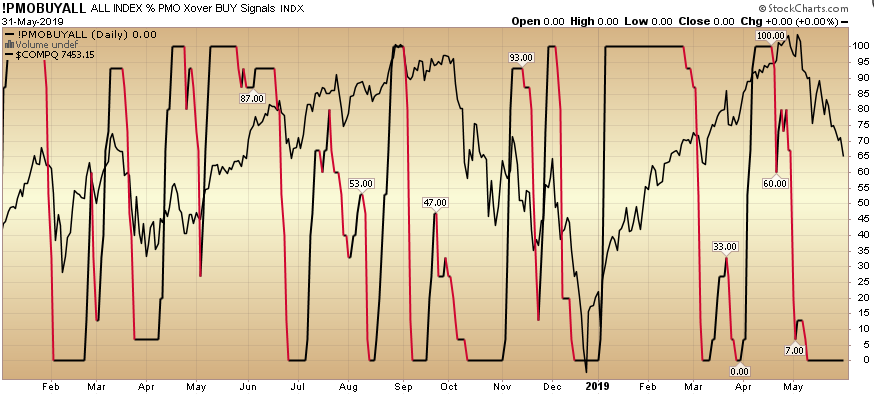
PMO BUY ALL coming off extreme level…
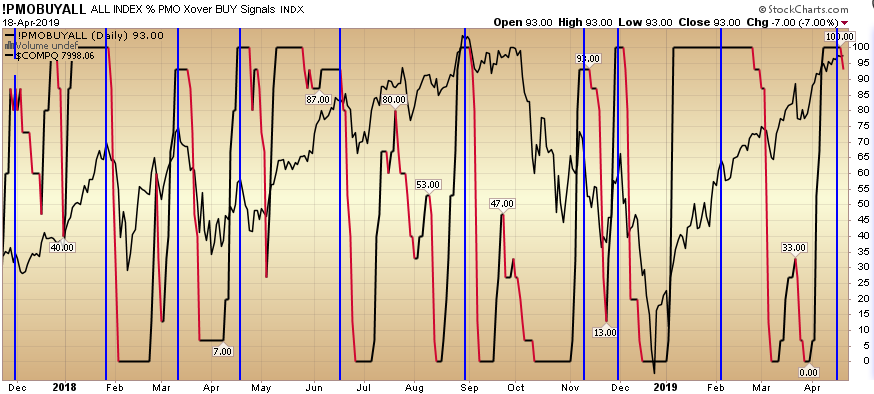
The PMO Buy All Indicator is starting to weaken off of an extreme (100) level. As you can see in the chart above, it has paid to get cautious in previous instances. Continue reading “PMO BUY ALL coming off extreme level…”