
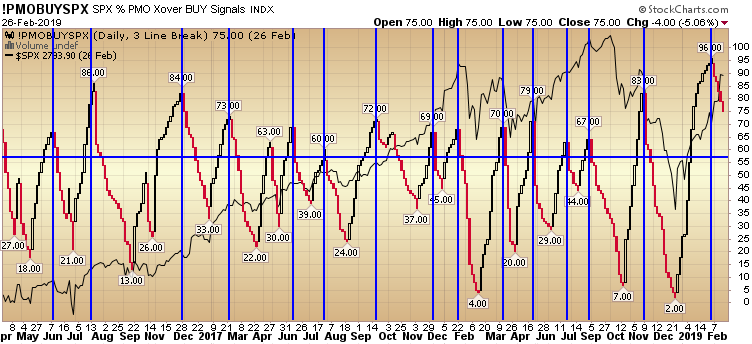
Since our post on February 14, the “PMO Buy SPX” indicator (above) has deteriorated from 83 to 75 and the “PMO Buy ALL” indicator has deteriorated from 100 to 93 (Click for “PMO Buy ALL” Chart). See our Continue reading “Update: PMO BUY SPX 78% (recent) Accuracy”
Category: Market Indicators (video)
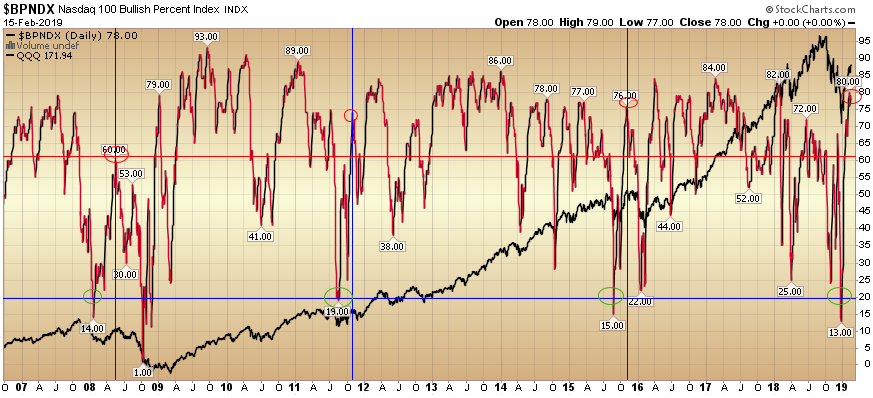
What “Nasdaq 100 Bullish Percent” is saying about the market now…
Yesterday we covered the S&P 500 Percent of stocks above the 200DMA and what it potentially implied for the S&P 500 moving forward.
S&P 500 % of Stocks Above 200 Day Moving Average Interpretation (recent accuracy 100%)
Today we are going to look at the Nasdaq 100 from a different angle. Continue reading “What “Nasdaq 100 Bullish Percent” is saying about the market now…”
S&P 500 % of Stocks Above 200 Day Moving Average Interpretation (recent accuracy 100%)
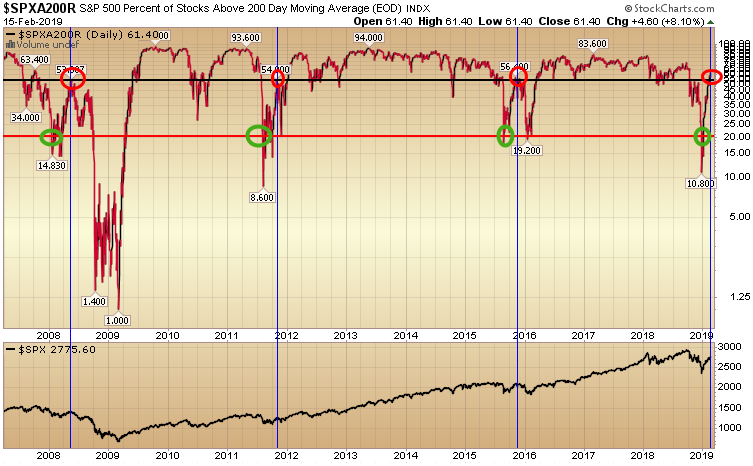
In trading, all you can do is take statistically advantaged positions and manage risk. Over a series of trades, if you do both well, you will outperform. Continue reading “S&P 500 % of Stocks Above 200 Day Moving Average Interpretation (recent accuracy 100%)”
PMO BUY SPX 78% (recent) Accuracy
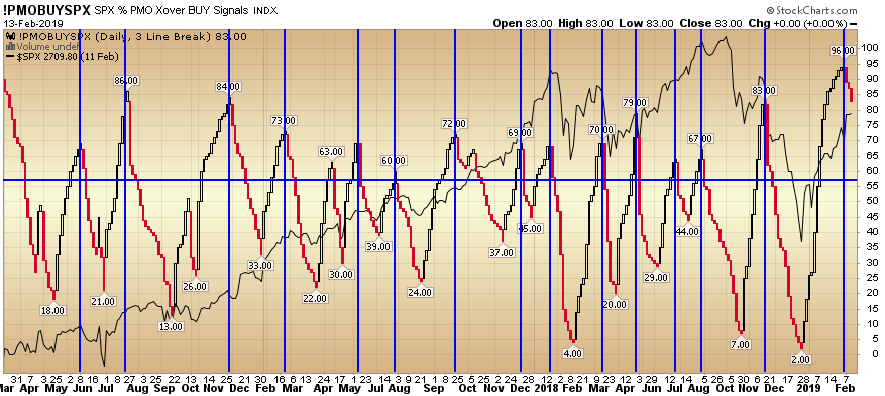
Last night we covered the “PMO Buy All” indicator which had a 70% accuracy rate for predicting pullbacks. Continue reading “PMO BUY SPX 78% (recent) Accuracy”
PMO BUY ALL 70% (recent) Accuracy
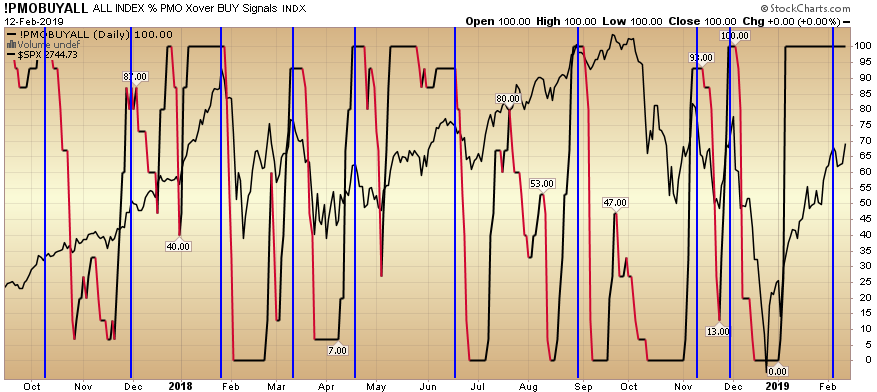
7 out of the last 10 times that the “PMO Buy All” indicator got to 100, it led to a short term correction in the general indices. In the chart I have annotated above, I show the PMOBUYALL in red/black, the S&P 500 in the Continue reading “PMO BUY ALL 70% (recent) Accuracy”
Bullish Percent – What it says about the Nasdaq Composite right now…
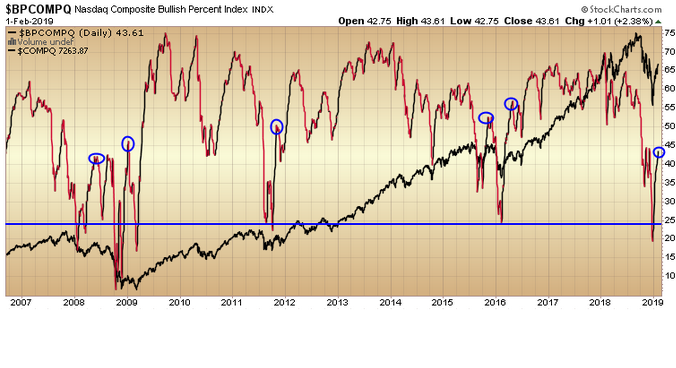
Right now, the “Bullish Percent” Nasdaq composite index is coming in at just 43.61%. The above chart is the “Bullish Percent Index” for the Nasdaq Composite (red and black line) with the Nasdaq Composite Index in the background (all black line). Continue reading “Bullish Percent – What it says about the Nasdaq Composite right now…”
Bullish Percent – What it says about Consumer Staples right now…
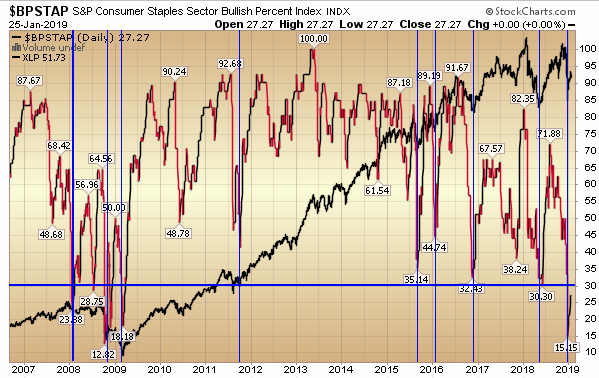
Right now, Consumer Staples as a sector has the lowest percentage of buy ratings of any sector in the S&P 500 – coming in at just 41%. The above chart is the “Bullish Percent Index” for Consumer Staples (red and black Continue reading “Bullish Percent – What it says about Consumer Staples right now…”
NYSE Advance Decline Volume
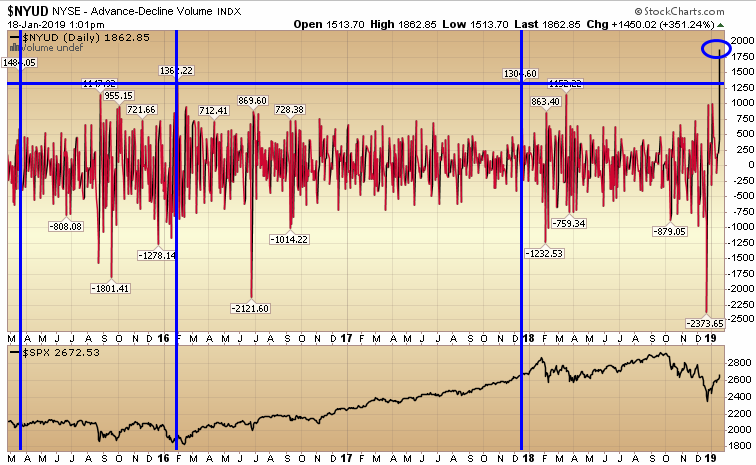
I have posted the $NYUD NYSE Advance Decline Volume indicator – which I have used as a barometer for many years. It’s currently at 1862 which is a very extreme reading and consistent with other periods of turnaround after Continue reading “NYSE Advance Decline Volume”
Bullish Percent – What it says about Financials ahead of Earnings
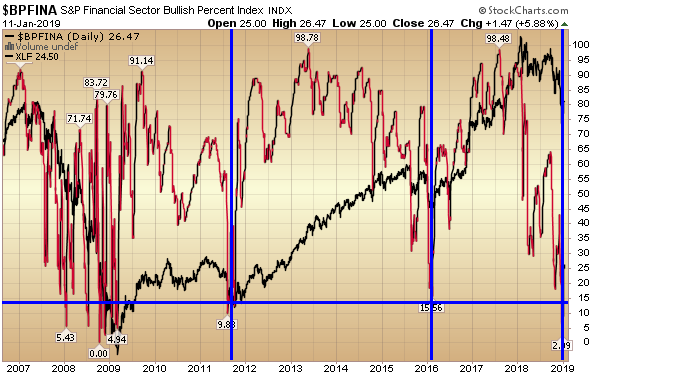
With bank earnings on deck, it’s a good time to take stock of the health of the Financial sector to anticipate possible moves in the sector in coming months. Continue reading “Bullish Percent – What it says about Financials ahead of Earnings”
Zweig up/down bottoming indicator triggered
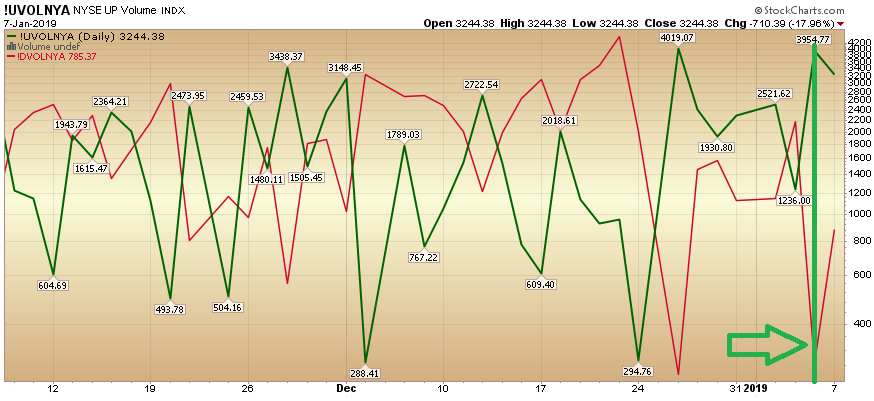
In his book “Winning on Wall Street,” the legendary Marty Zweig explained the value of volume ratios. A ratio of 9:1 or greater of up/down volume is considered to be very bullish and 9:1 down/up volume is considered to be very bearish. Continue reading “Zweig up/down bottoming indicator triggered”