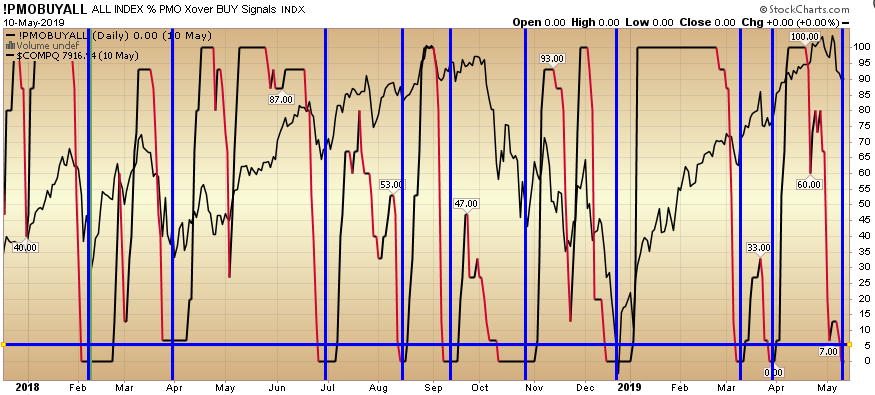
The last 9 times the PMO “Buy All” indicator dropped below 5, it has paid to buy the market for a bounce. It is currently at zero. The blue vertical lines mark those spots where the indicator dipped below 5 in the past 1.5 years. Continue reading “PMO BUY ALL at Extreme”
Category: Market Oscillators
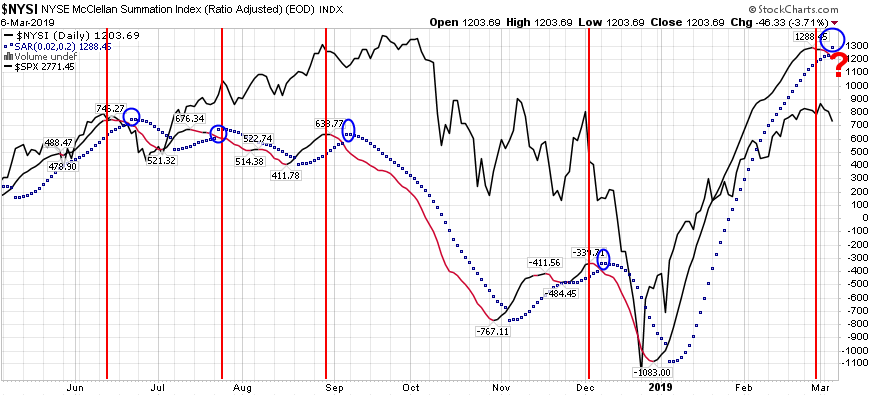
NYSI FINALLY FLIPS – What’s Next?
On March 2 (this past weekend), we posted about the NYSI Oscillator + Parabolic SAR. We said that while the black line had turned to red, we were still waiting on the Parabolic SAR dots to flip for confirmation. Today they Continue reading “NYSI FINALLY FLIPS – What’s Next?”
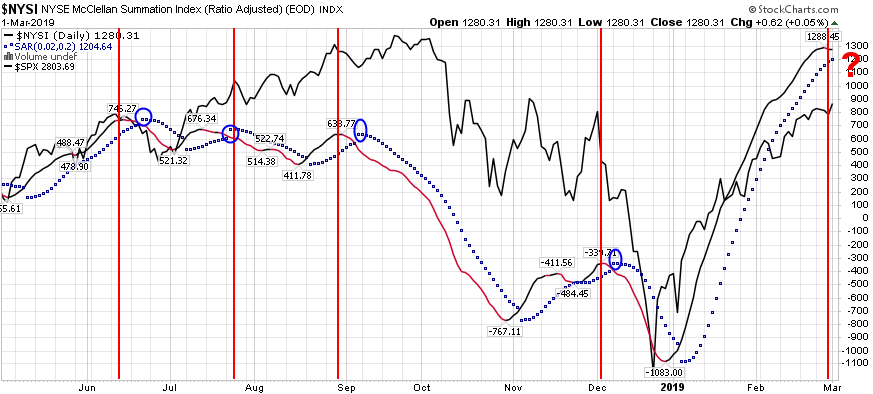
(100% recent accuracy) NYSI McClellan Summation Index + Parabolic SAR
The McClellan Summation Index above is a breadth indicator derived from the McClellan Oscillator, which is a breadth indicator based on Net Advances (advancing issues less declining issues). The Summation Index is Continue reading “(100% recent accuracy) NYSI McClellan Summation Index + Parabolic SAR”
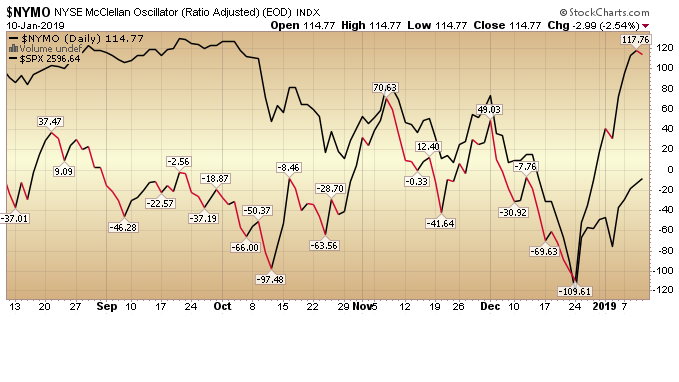
NYMO short term oscillator
Yesterday I put out a post about the AAII Sentiment survey and that it would potentially portend a few days to a week of sideways/possibly down consolidation to work off the short term exuberance. Another short term indicator I have used for many years is the NYMO or the NYSE McClellan Oscillator Continue reading “NYMO short term oscillator”
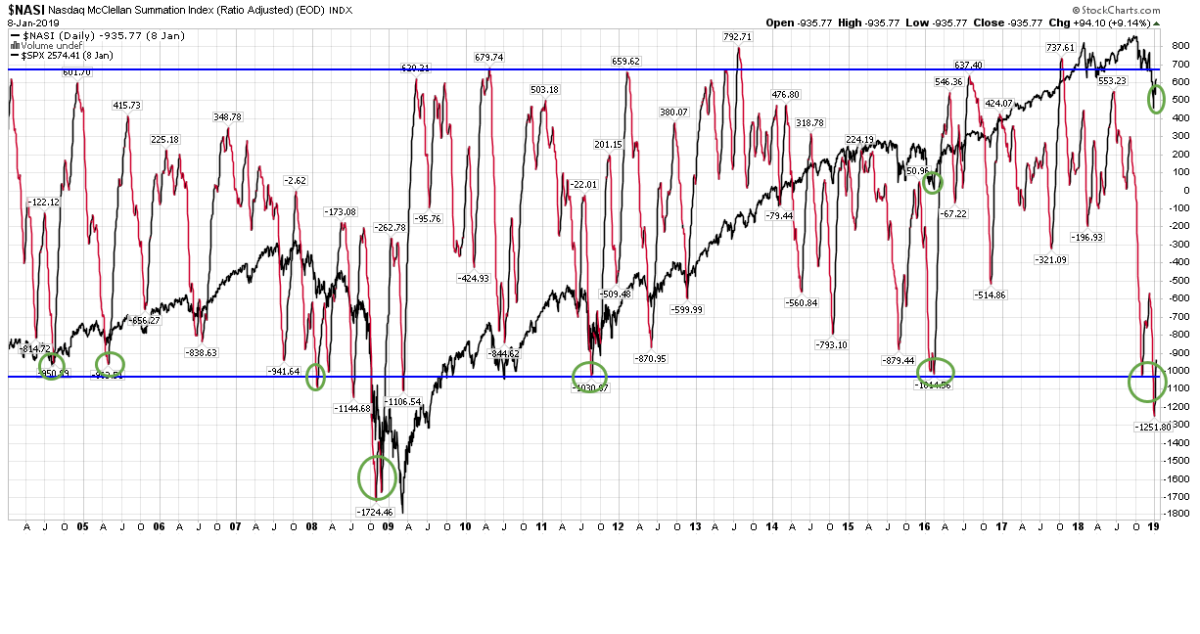
NASI indicator
I’ve always used the Nasdaq McClellan Summation Index as a barometer for risk in the market. The McClellan Summation Index is a breadth indicator derived from the McClellan Oscillator, which is a breadth indicator based on Continue reading “NASI indicator”

