This week I chose Country Legend Tim McGraw’s song, “I Like It, I Love It” to embody the current sentiment of the Stock Market. While anyone who has been around knows – it can change on a dime – right now, market participants are enjoying the ride and singing along:
This week we selected a legendary song from the Eagles entitled, “The Long Run” to embody the theme of our stock market commentary. The specific lyrics we want to focus on are:
You can go the distance We’ll find out In the long run (In the long run) We can handle some resistance…
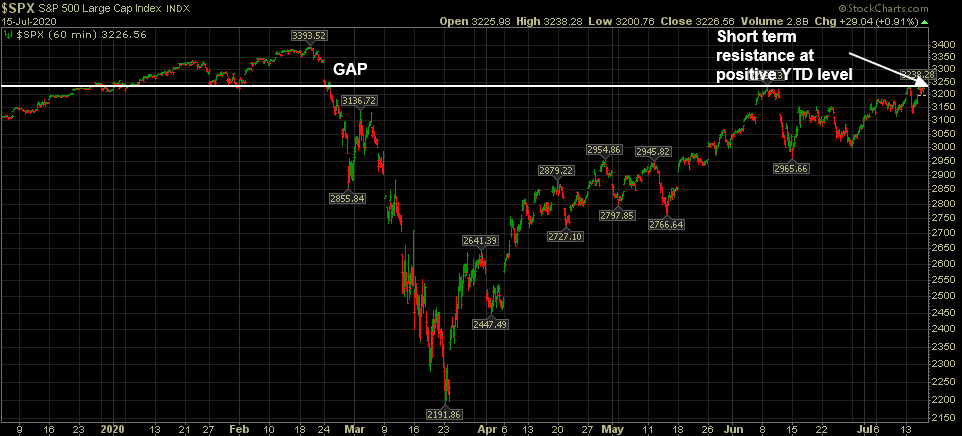
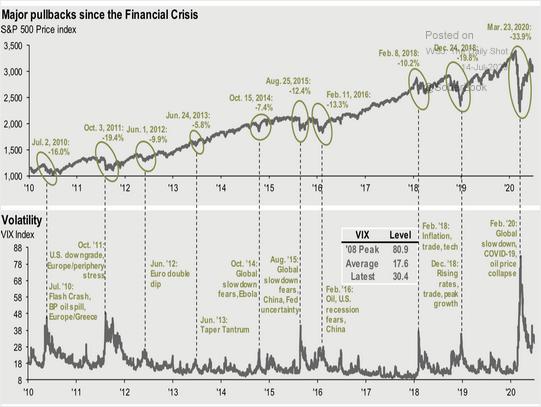
As Glenn Frey so eloquently sang, “We can handle some resistance…” Right now, we are knocking on resistance at the level that would make the S&P 500 go positive for the year. It is the second time we are knocking and we will find out if the door is finally opened. If so, it would not be unreasonable to fill the late February gap pointed out above.
On Tuesday, I was invited on CNBC Indonesia to talk about the U.S. stock market and recovery. Thanks to Maria Katarina and Yoliawan Hariana for having me on. In this segment I cover the following issues:
U.S./China Relations
U.S. Stock Market Overview and Current Outlook
COVID spikes/declines/implications/resolutions.
Value vs. Growth
Emerging Markets Outlook/History
U.S. Dollar
Hedges For Inflation
Thoughts on Gold
Thoughts on safety
Banks
Commodity Trends and Outlook
End of year Stock Market Outlook
Great Rotation
On Monday, I was on Fox Business, “The Claman Countdown.” Thanks to Liz Claman and Ellie Terrett for having me on. In this segment I cover the following issues:
Growth/Tech versus Value/Cyclicals.
Under what conditions do each group outperform?
Banks
On Tuesday I was on CGTN America. Thanks to Mike Walter and Zeina Al-Shaib for having me on. In this segment I cover the following issues:
China Recovery/Data
COVID Data/Resolution
Economic Surprise Index
“Sell the rumor, Buy the news”
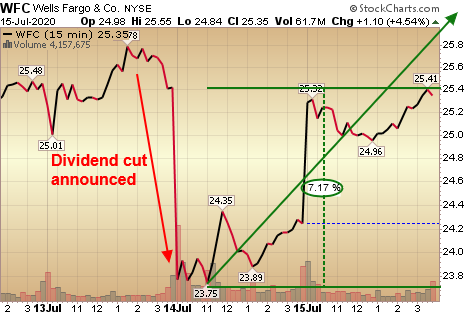
In the past few weeks we have been talking about the opportunity in banks – with emphasis on Wells Fargo. The thesis, (which you can read below) is that once the bad news (dividend cut and huge credit provisions) was out and fully “kitchen sinked” there would be few sellers left. So far the thesis is playing out:
It may not be a straight line up, but I anticipate this movie plays out well over time – as it has many times before.
In case you haven’t turned on a TV in the past few weeks (and especially days), this is not a popular point of view:
In last week’s note we also added further color from Warren Buffett’s interview (the last time Wells cut their dividend by 85% – this time was only 80%!) in 2009 (mid-way down the page):
On CNBC London (Wednesday morning) I talked about how due to the new CECL (pronounced Cecil) accounting requirements, banks were essentially required (for the first time) to take 100% of their expected credit losses for the entire cycle all at once and UP FRONT. They did that in this week’s earnings reports. Thanks to Sophie Rose for having me on the show. You can view the segment here:
The CFO of Wells Fargo was on CNBC America at 3pm – effectively saying he believes they are 100% provisioned at this point. A fancy way of saying they “kitchen sinked” everything now so they can beat like expectations like crazy moving forward. The market is beginning to sniff this out. You can view Wilfred Frost and Sara Eisen’s interview with WFC CFO John Shrewsberry here:
“We believe that we’ve captured all the loss content (in the portfolio).”
“The Contrarian Trade”
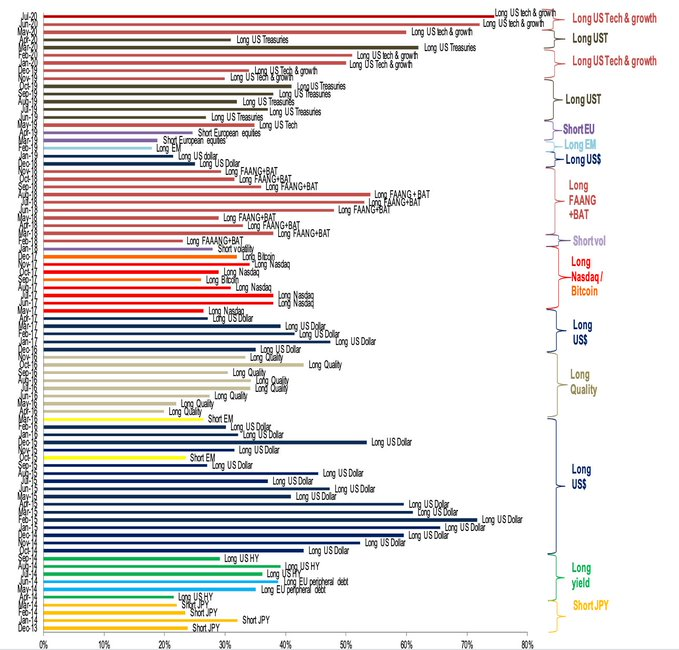
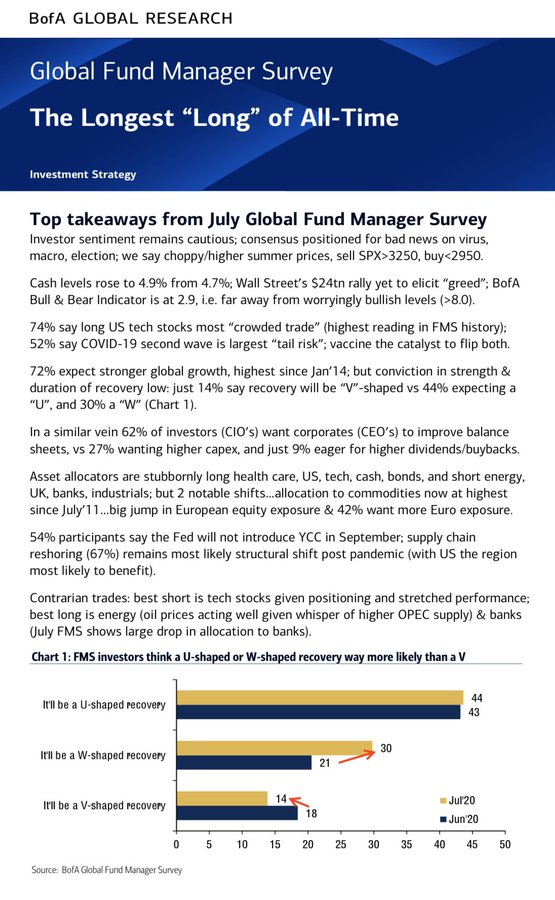
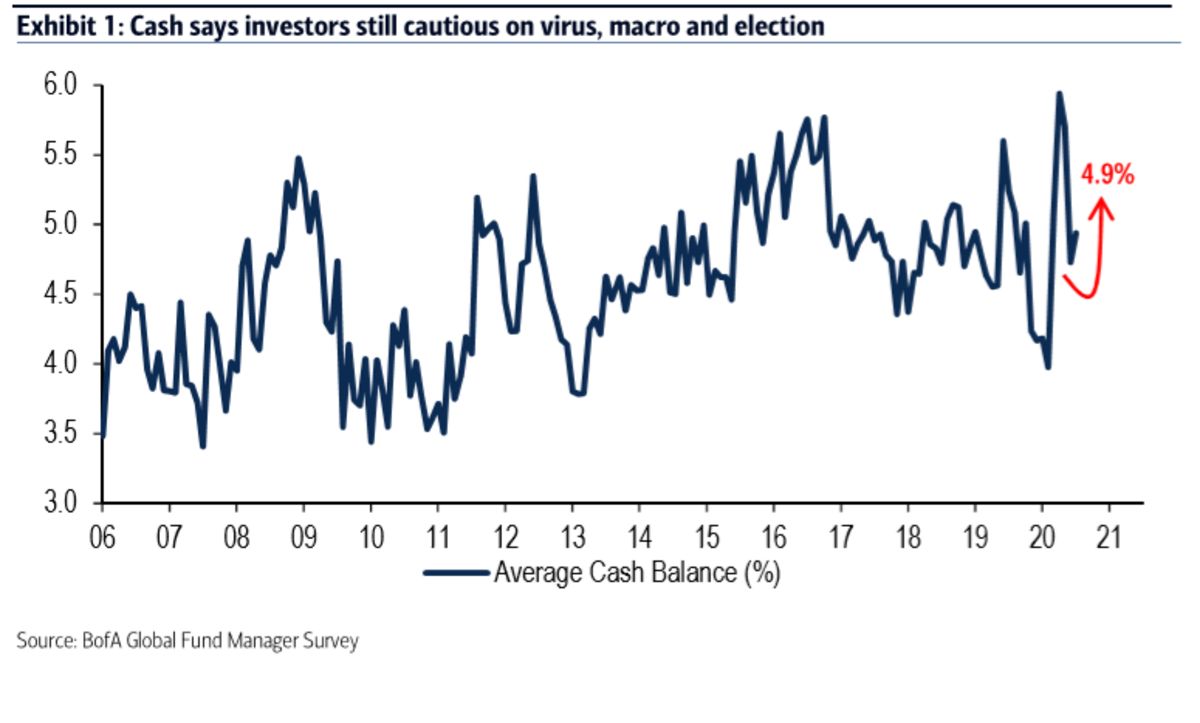
This week, Bank of America put out their monthly survey to ~200 asset managers that collectively run ~$500B AUM. We did a summary of the findings on Tuesday (which you can read below), but here are the key findings that stood out to me:
•Conviction in the recovery is low, just 14% saying it will be ‘V’ shaped.
•Cash up to 4.9% from 4.7%.
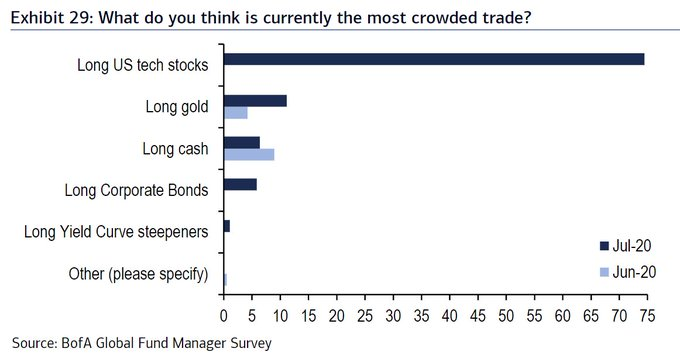
•74% say long US tech stocks are the most “crowded trade” – the most in the survey’s history.
As I covered in the segment with Liz Claman on Monday, cash flows into tech/growth when there is fear that the recovery will be slow and uneven (end of June/early July when Sunbelt cases spiked). Cash flows into cyclicals/value when it looks like the recovery will be fast (cases coming down like in May).
In my view “V” shaped is code for “Vaccine” and now that we have a considerable number of contenders exceeding timelines on expectations, money is beginning to move into cyclicals again this week.
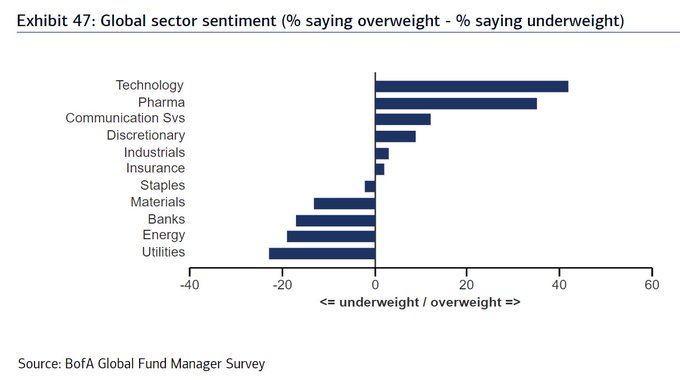
So with cash increasing, conviction decreasing, and overcrowding in tech, Bank of America put out a contrarian trade (which we have been discussing in recent notes). As you can read in my summary below, BofA says,for a contrarian trade:
Short Tech Stocks and Buy Banks and Energy
I agree with the latter as you can review in my previous weeks’ notes and VideoCast/Podcasts, but the former has to be nuanced. While I think cyclicals can and will outperform in the early stages coming out of the recession – as is historical precedent, I do not think tech is a blanket short. It is nuanced and outperformance of value/cyclicals does not have to be a zero sum game. Many tech stocks will perform even if/when cyclicals begin to outperform.
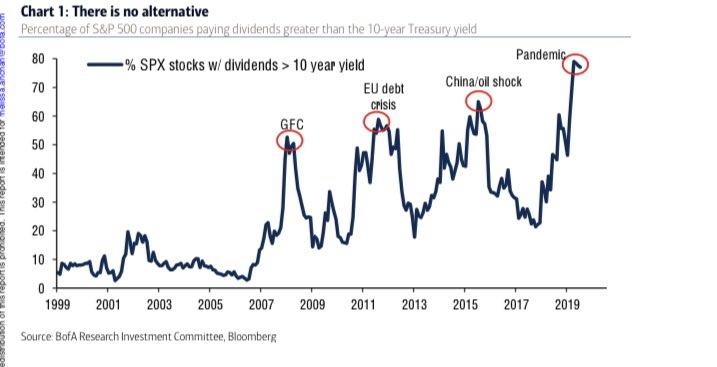
I came across this chart from Bank of America to re-emphasize a point I made in recent weeks. At each of these points (when the percentage of stocks in the S&P 500 with dividend yields greater than the 10 year Treasury exceeded 50%), it has paid to get and hold equity exposure.
This also lines up with periods of declining volatility (following a crisis spike):
Source: Wall Street Journal
Now onto the shorter term view for the General Market:
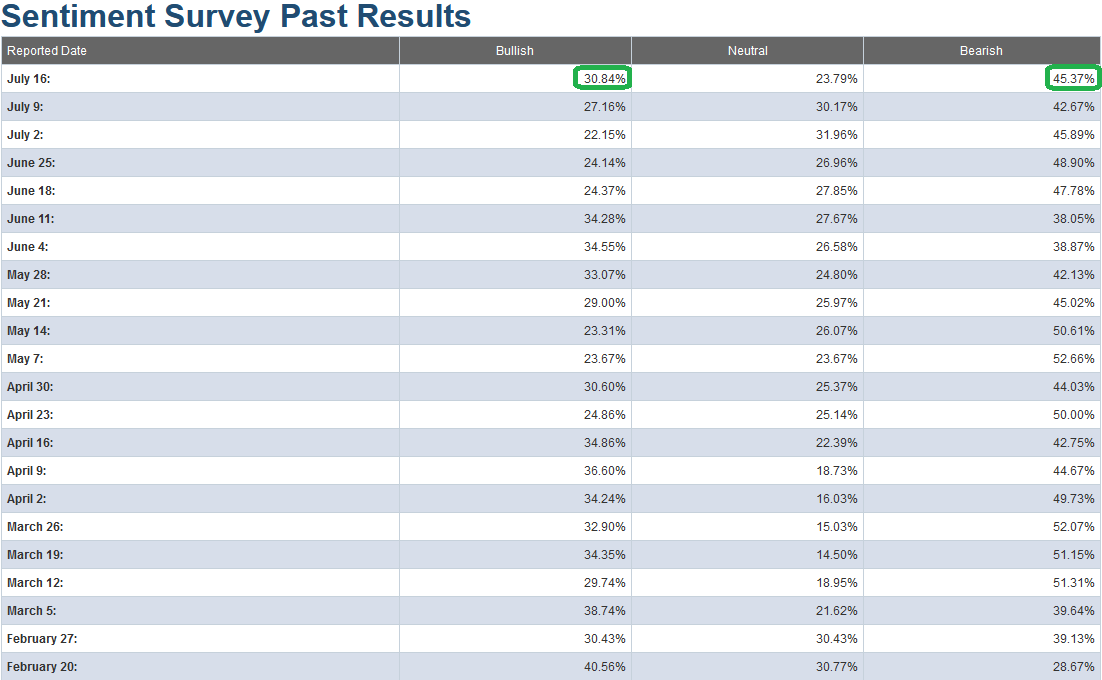
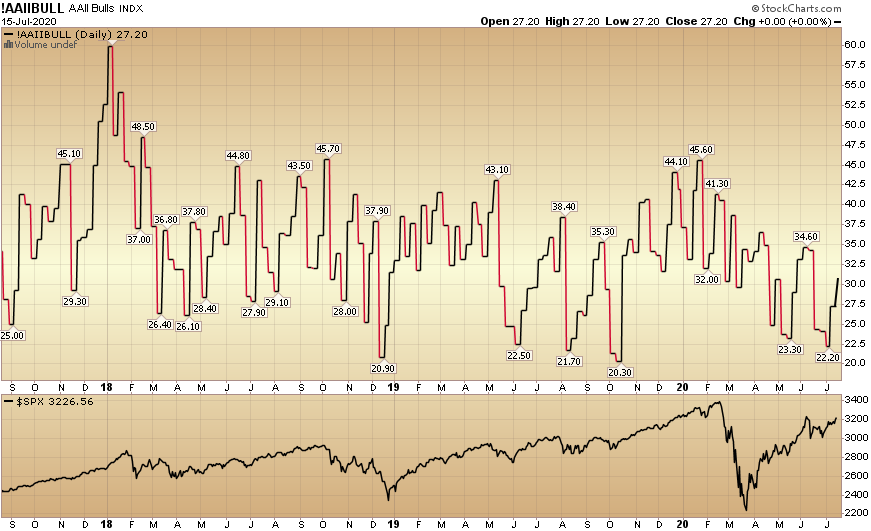
In this week’s AAII Sentiment Survey result, Bullish Percent (Video Explanation) rose to 30.84% from 27.15% last week. Bearish Percent rose to 45.37% from 42.67% last week. These are levels that historically still favor being a buyer versus a seller. It is nice to finally see the extreme pessimism/skepticism of recent weeks beginning to thaw, but we have a long way to go until we are anywhere near euphoric levels on this measure (despite being at a four week high). Until then, we can climb the “wall of worry.”
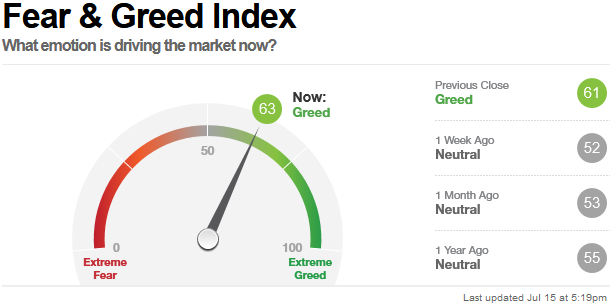
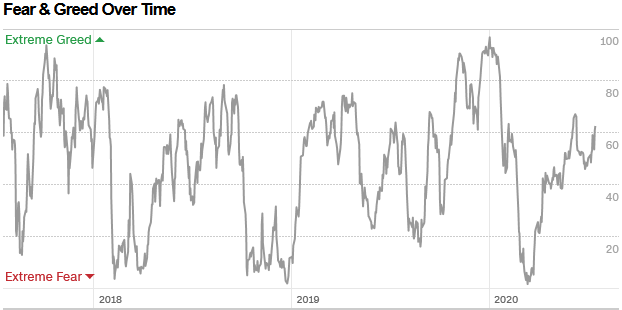
The CNN “Fear and Greed” Index moved up from 53 last week to 63 this week. Despite the market moving up >40+% off the lows, we have still not hit an extreme/euphoric level (>80/90) yet. You can learn how this indicator is calculated and how it works here: (Video Explanation)
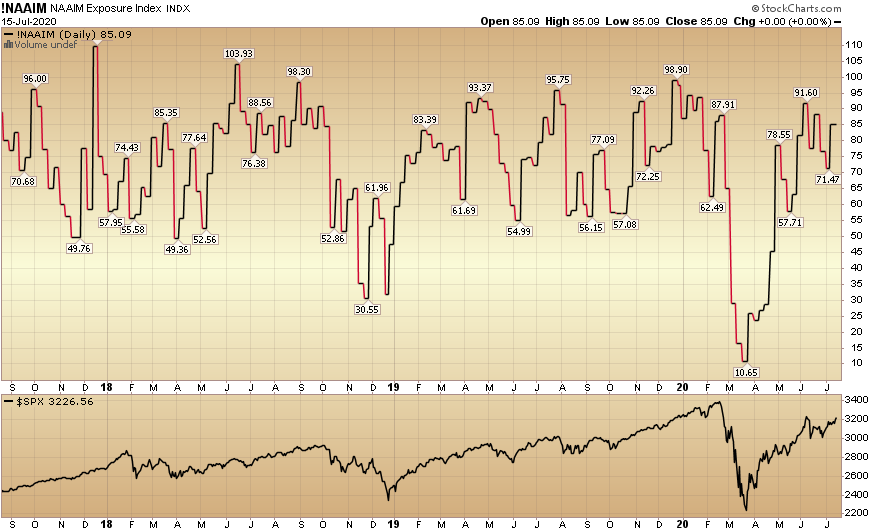
And finally, this week the NAAIM (National Association of Active Investment Managers Index) (Video Explanation) rose from 71.47% equity exposure last week, to 85.09% this week.
Our message for this week:
We remain very constructive in the intermediate term and will take advantage of any additional buying opportunities in laggard/cyclical names – should they arise over the Summer/Fall.
In the interim we will hold what we have and shave only in the event we DO hit levels of euphoria that we have not seen since February (we are not there yet).
Until next time:
You can go the distance We’ll find out In the long run…
210 Managers overseeing $570B AUM responded to this month’s BofA survey.
OUTLOOK:
•72% expect stronger global growth. This is up 11 percentage points from last month (highest level since January 2014).
•36% – the highest figure recorded – expect the global economy to get “a lot stronger” and profits to improve in the next 12 months.
•Conviction in the recovery is low, just 14% saying it will be ‘V’ shaped, 30% say ‘W’ Shaped – up from 21% last month. 44% expect a “U” shaped recovery.
•37% of respondents see higher global consumer price inflation in the next 12 months, but only 5% said inflation will be a lot higher.
•71% still think that the stock market is overvalued (down from 80%).
•The percentage of investors expecting the euro to appreciate also rose in July.
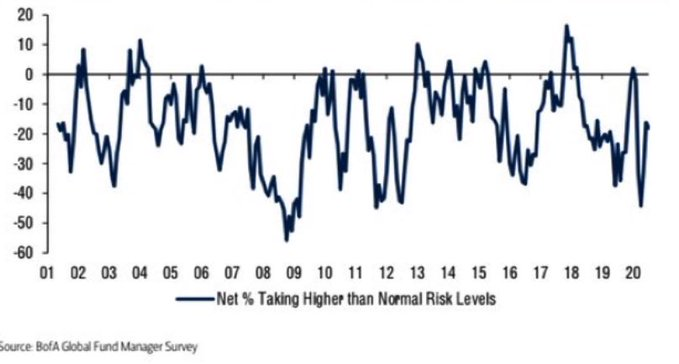
•Wall Street’s $24 trillion rally yet to elicit “greed.”
•54% say the Federal Reserve will not inplement yield curve control in September.
SENTIMENT:
POSITIONING:
•Cash up to 4.9% from 4.7%. This is down from April/May, but still on the high side. (10-year average is 4.7%)
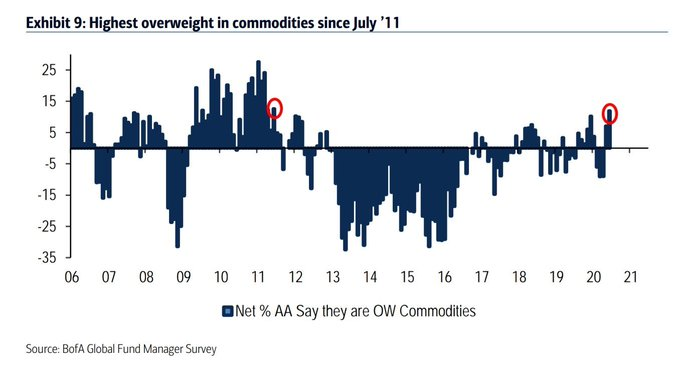
•Allocation to commodities was the highest in July since 2011 at Net 12% of respondents.
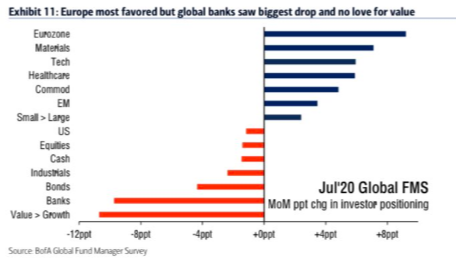
•Big jump was seen in European equity exposure driven by the European Union’s fiscal policies. Currently 16% net overweight allocation to Euro equities (up 9%).
•Allocation to U.S. equities declined 1 percentage point to net 21% overweight; the U.S. remains the survey’s most popular region
MOST CROWDED TRADE:
•74% say long US tech stocks are the most “crowded trade” – the most in the survey’s history.
BIGGEST TAIL RISKS:
1. 2nd wave of COVID infections as a top tail risk (52% of respondents).
2. US Elections – Blue Wave. Despite this risk, 34% plan to take no action ahead of the election. 31% are reducing risk, 15% are buying volatility and 13% are selling the U.S. dollar.


 •Cash up to 4.9% from 4.7%. This is down from April/May, but still on the high side. (10-year average is 4.7%)