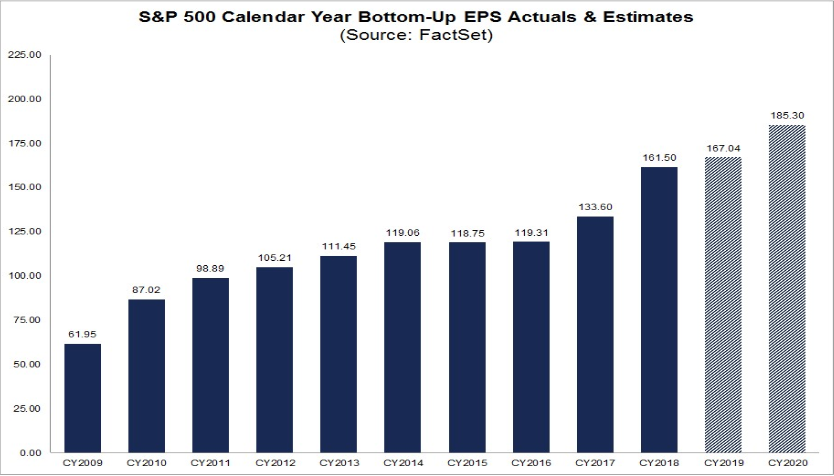
Since there was no change in Q2 EPS estimates since my post last Friday, I decided to post the longer view of Earnings Estimates for the remainder of CY 2019 and CY 2020.

My first takeaway from the chart above was the flat sideways movement of the S&P 500 index for 2018-2019 was discounting the flattish earnings of 2018-2019. This looks very similar to 2015-2016 when you also had flat earnings and flat price action for ~18 months (and to a lesser extent, 2011-2012 which had flattish earnings and traded in a sideways range until it broke out to discount the increased earnings in 2013-2014).
As I said in my article on Wednesday, the market is a discounting mechanism, and just as the market began to discount the jump in earnings in 2017 and 2018 at the end of 2016, we should start to see 2020 earnings begin to get discounted with higher prices in coming months (provided the Fed lowers the discount rate this month to give us ample liquidity for some multiple expansion). Read Wednesday’s article here:
AAII Sentiment Survey: The Wall of Worry is Steep. Keep climbing!


