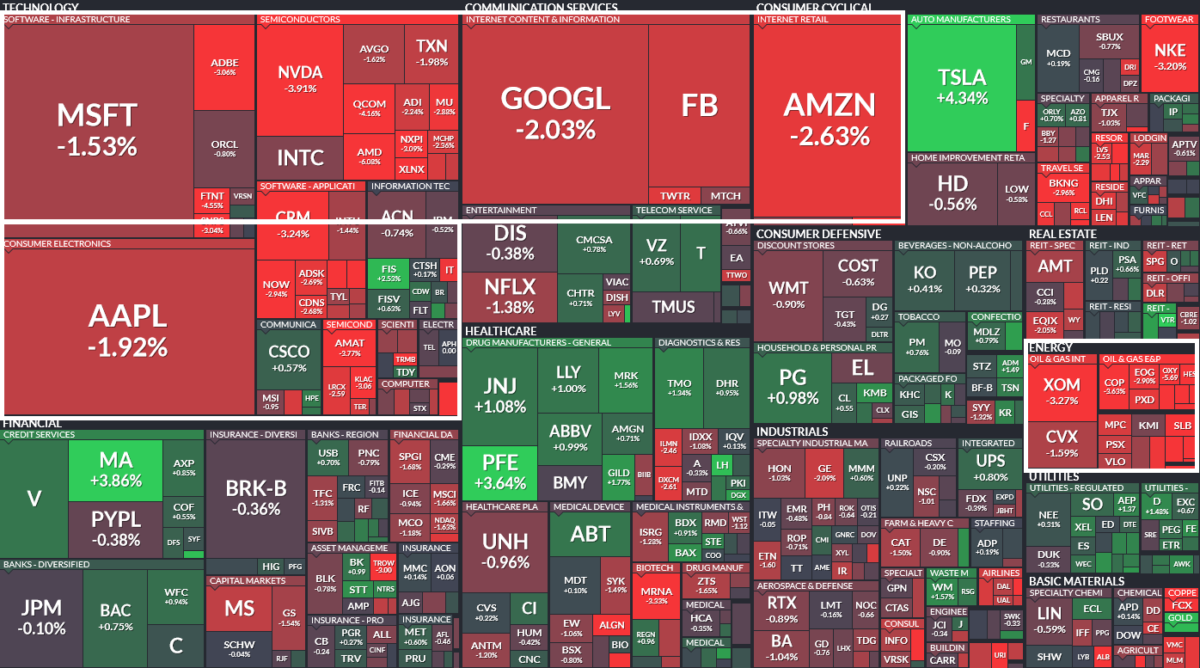
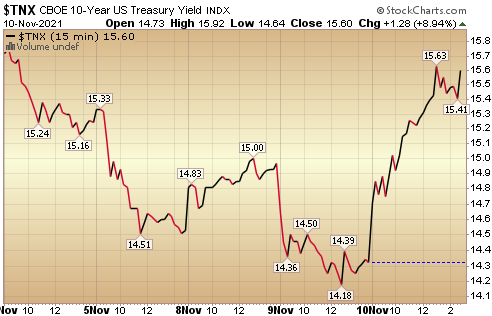
For the first time since Chair Powell announced taper last Wednesday, the Treasury market behaved as one would expect. Yields were up on the 10yr Treasury and “Long Duration” earnings stocks (high-multiple tech names) were down.
Energy names were also down after reporting a 1M bbl build and headlines regarding the Iran nuclear deal talks were ubiquitous. If successful, an Iran deal would add 400,000-500,000 bbl/day to global supply.
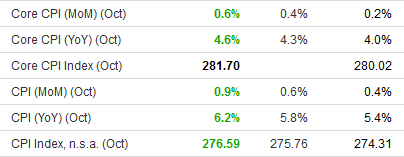
The catalyst for the move (in yields) was higher than expected inflation numbers released:
![]()
I do think the counter-trend move following last week’s taper announcement was more structural (short covering and liquidations) than fundamental. As we have repeatedly pointed out in recent podcast|videocast(s), managers were all on one side of the boat (short bonds) and many experienced pain in recent weeks following the moves of Central Bankers:
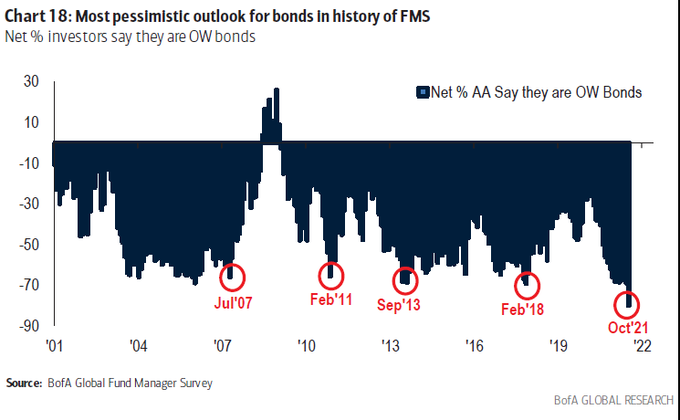
- More pain likely for hedge funds as leveraged investors unwind wrong-way bond market bets, traders say (marketwatch)
- “10 To 20 Asset Managers Are Being Liquidated” – Rate Vol Exploding Just As Funds Pile Into Repo Trade That Blew Up Market (ZeroHedge)
- Treasury Market Becoming Increasingly Distorted By Record Bearish Sentiment (And Shorting) (ZeroHedge)
- A Wrong-Way Bet on Bond Yields Triggered Rokos, Alphadyne Losses (Bloomberg)
As we laid out last week, the price retreats we are seeing among a broad range of commodities (Soybeans, Corn, Lumber, Milk, Lean Hogs, etc) will show up on a LAGGED basis in coming months’ reports. Until then you will see prominent “non-economists” stoking fears about hyper-inflation.
Here are the data points they will lean on:
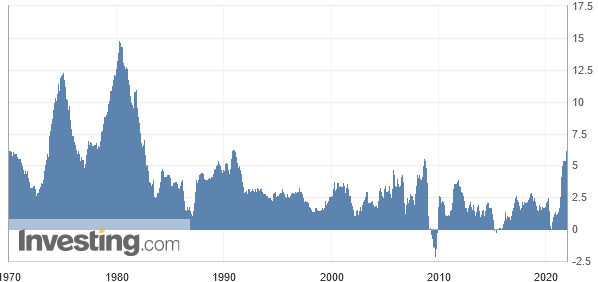
The year-on-year change in inflation was the highest since 1990:
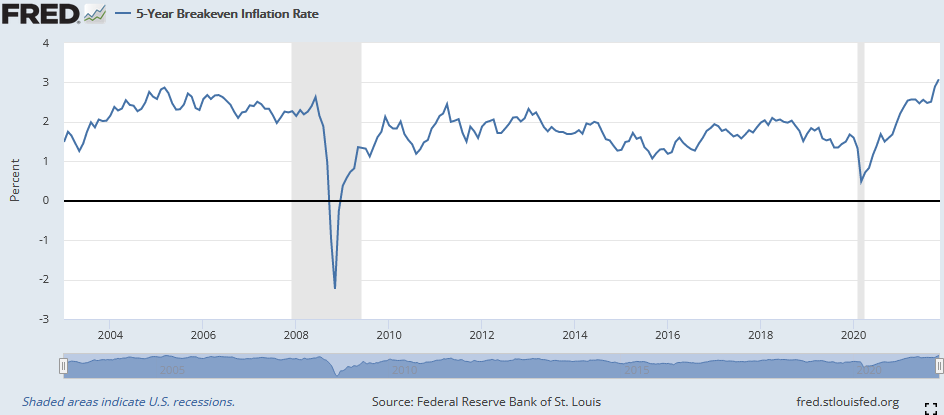
The Five Year breakeven inflation rate represents a measure of expected inflation derived from 5-Year Treasury Constant Maturity Securities and 5-Year Treasury Inflation-Indexed Constant Maturity Securities. The latest value implies what market participants expect inflation to be in the next 5 years, on average. It is now at 3.08%:
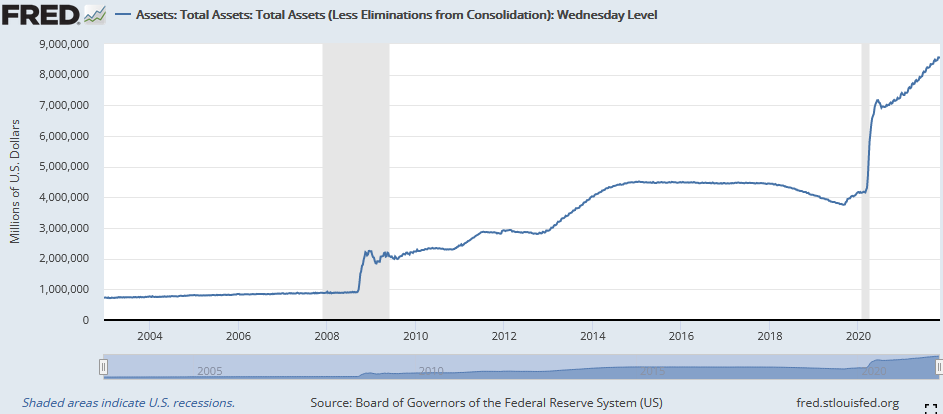
The Fed Balance sheet has doubled since the beginning of the pandemic and will add another $660B during the taper period:
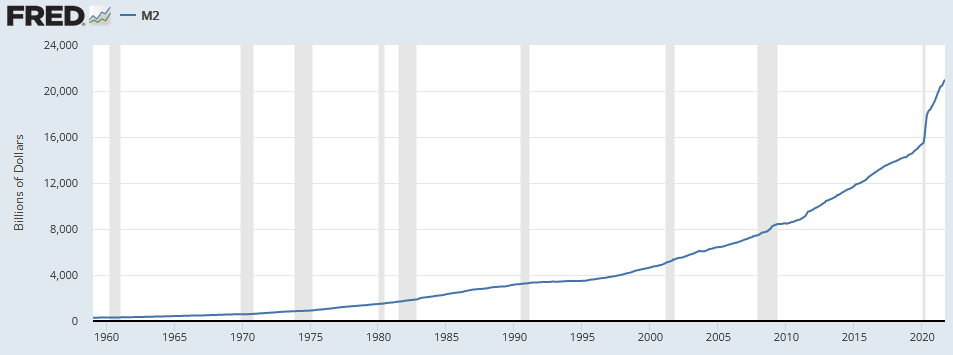
M2 Money Supply has gone parabolic since the beginning of the pandemic (growing 37.9% since March 2020):
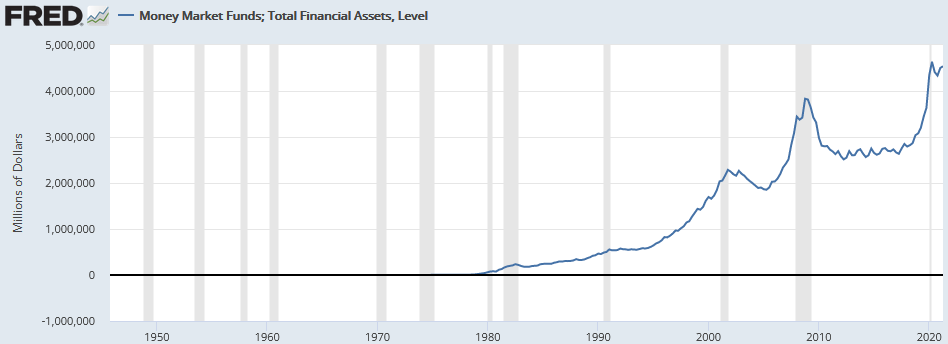
Money Market Fund balances are at all time highs:
So the argument goes, “inflation is when too much money is chasing too few goods.” We are seeing some of that in the short term as the supply chain bottlenecks limit supply. We are seeing wage inflation due to lower supply of labor [labor force participation rate (covered last week)].
The key question is, “what would have to happen for the ‘hyper-inflation’ camp to be right?” The answer is that the “Velocity of Money” would have to pick up materially.
Definition (FRED): “The velocity of money is the frequency at which one unit of currency is used to purchase domestically- produced goods and services within a given time period. In other words, it is the number of times one dollar is spent to buy goods and services per unit of time. If the velocity of money is increasing, then more transactions are occurring between individuals in an economy.”
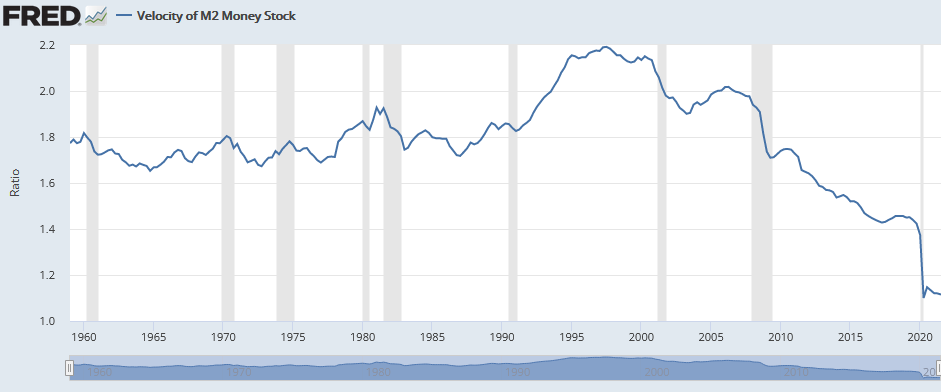
While the first half of the equation is there (too much money), the last half is not (chasing too few goods). The shortage of goods will be temporary and we are already seeing a shift from purchase of goods to purchase of services (soon to be travel and leisure explosion).
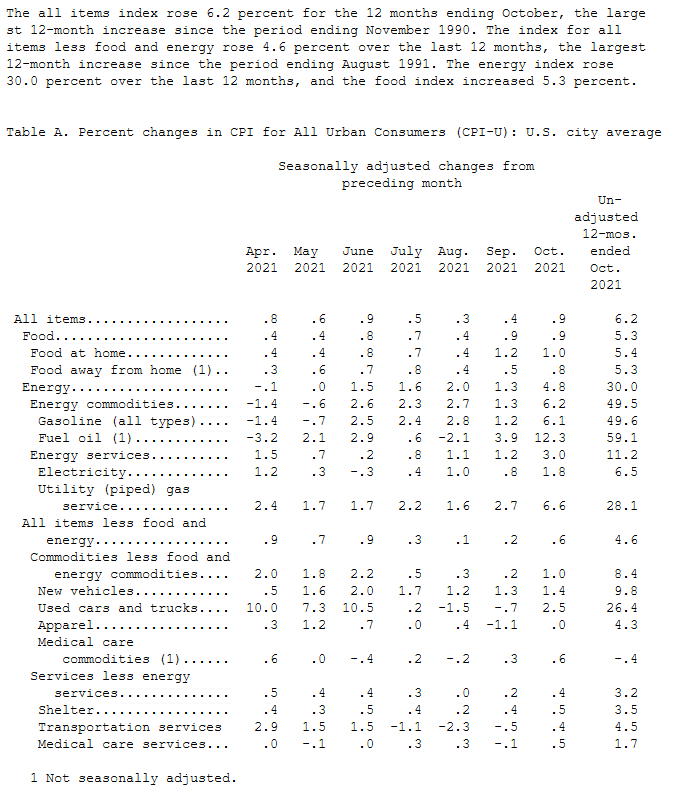
So if we are seeing inflation in goods, energy and wages, but nowhere in proportion to the percentage of money created over the last ~20 months (i.e. inflation is not 37%), where is all of the money going?
MONEY IS GOING INTO ASSETS. Stock Market, Real Estate, and non-productive assets like savings, money markets, commodities, crypto, and NFTs. Until that changes, the calls for hyper-inflation are unfounded.
That said, we do believe the 5 yr – breakevens are realistic and we could certainly see “Above-Trend” inflation (not-hyper or runaway) for years to come (3% inflation versus 2% we have struggled with for two decades). This will be driven by 72M Millenials (average age ~30) starting housing and family formation – which drives spending (just as we saw in the last two younger population boom periods of 1982-2000 and 1948-1968). It will be partially offset by the deflationary effect of technology and automation.
“Above-Trend” (not runaway) inflation is GOOD for the economy because it ignites animal spirits. Over the past two decades there was little incentive to buy many goods as there was no fear of loss to “act now” due to prices rising in the future.
Also, businesses were more reluctant to invest because they did not have the flexibility to raise prices. We are seeing the second highest margins in history for Q3 earnings season – as companies are passing through higher costs. People feel a bit better because their wages are going up and employers have to compete for their labor.
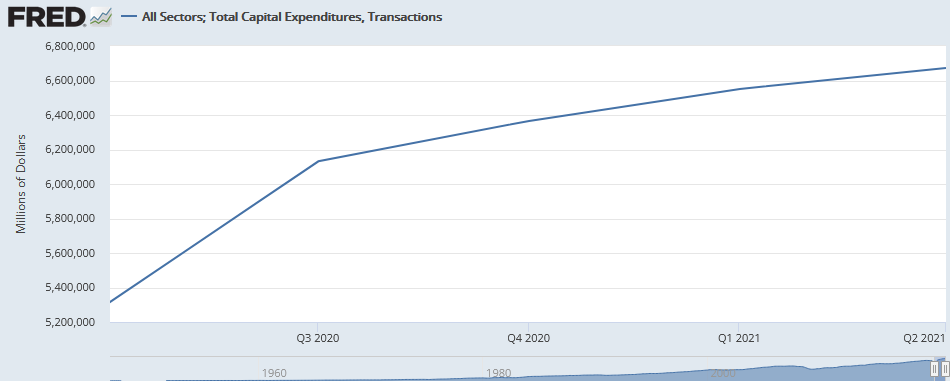
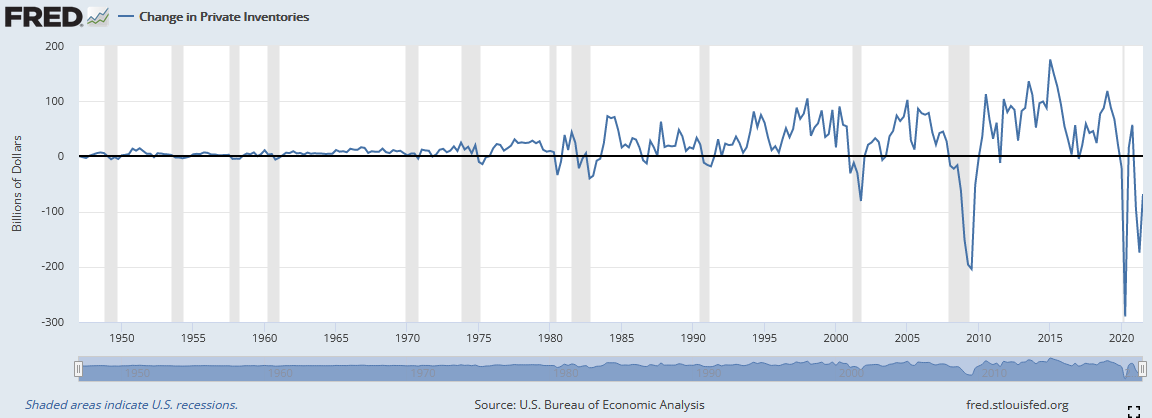
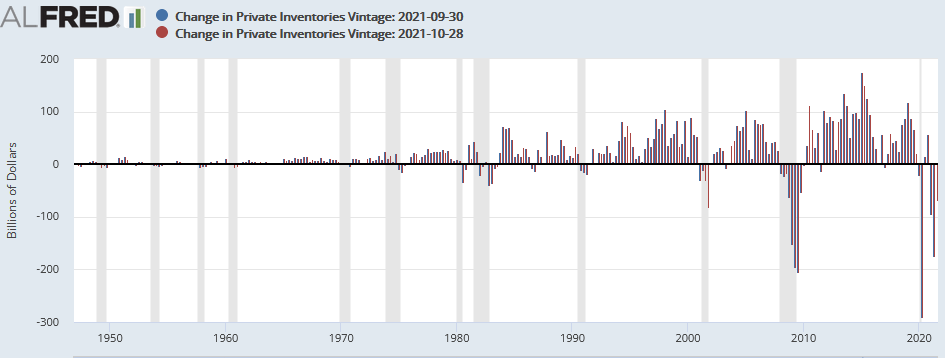
The economic story to carry us through 2022 will be CAPEX spending by businesses (which were delayed as businesses hunkered down for a depression in 2020), and Inventory Rebuilding (inventories are still depressed). Both will be positive for the economy:
Rates
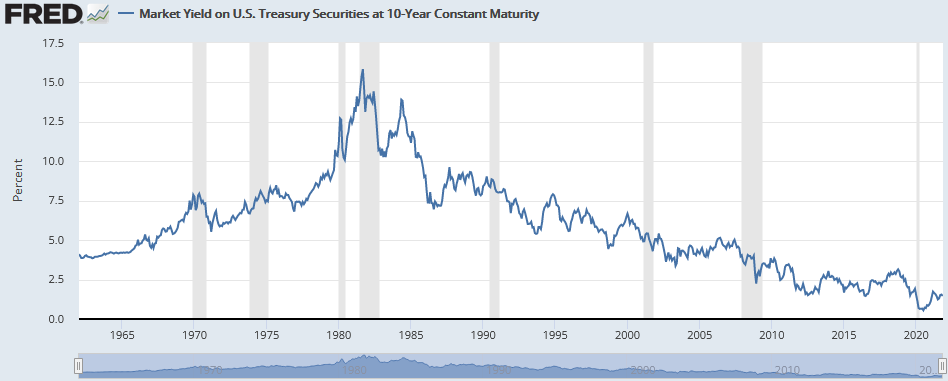
We are in tricky situation as it relates to rates. While I had previously said that we expected the 10-yr yield to move to 2-2.5% before taper and that would likely be the peak in the ten year yield for the cycle (like happened in December 2013 when they announced taper), the peak of ~170bps reached before the announcement last week seems a little low for the cycle peak.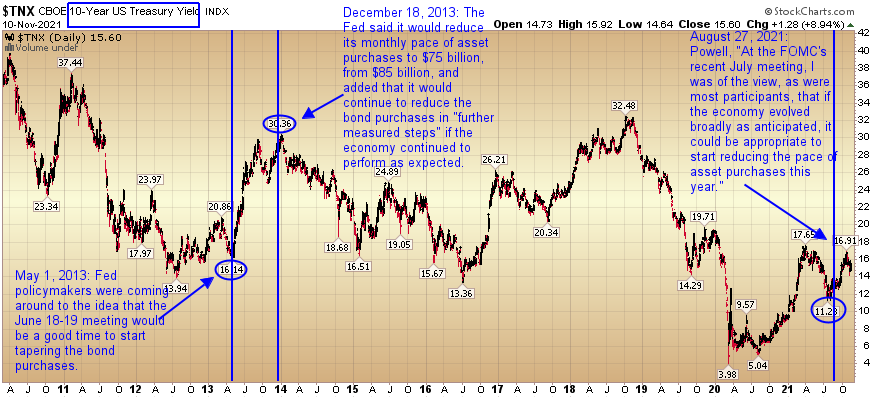
For those who think the Fed can’t allow rates to go up because we have too much debt and the interest payments are too high, you’re partially right. We have too much debt for sure (but we will likely inflate/grow down this debt/GDP ratio over time):
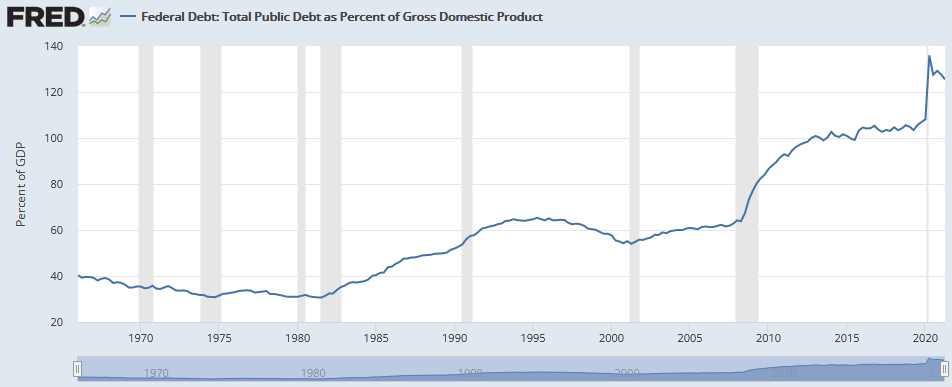
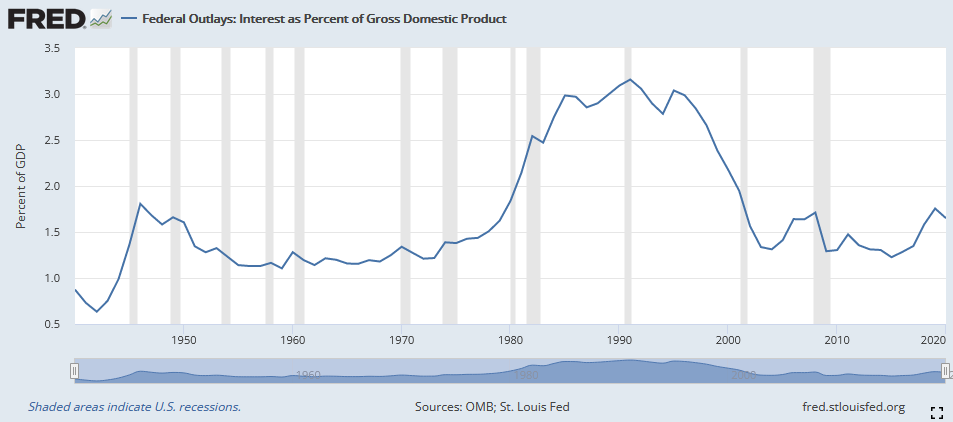
As for interest payments on that debt as a percentage of GDP, we are on the low end of the 80 year range depicted below:
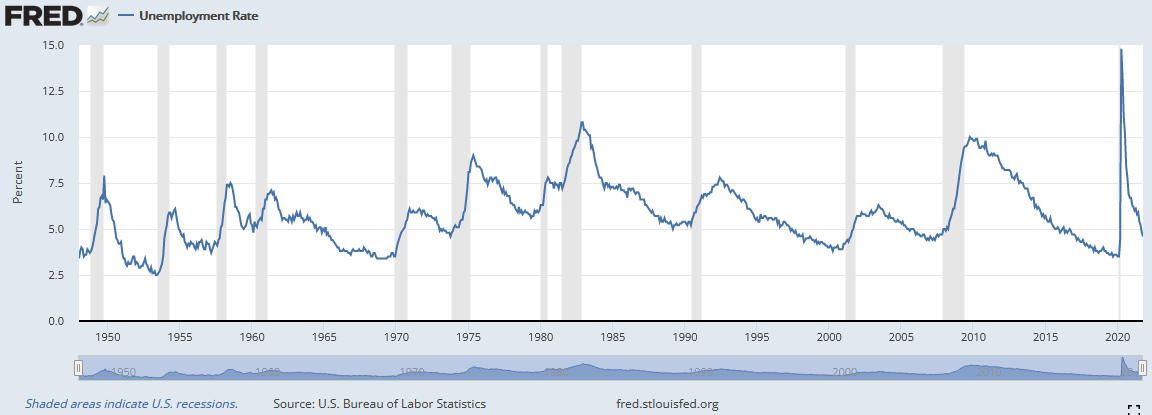
Despite Chair Powell not following his own guidance to prioritize full employment before announcing taper, it is still a priority for him (provided he keeps the job). Lael Brainard was also interviewed for the job this week and she is known to be more dovish than Powell (i.e. she might slow down taper and rate hike expectations). If Powell stays, he still has some work to do if he wants to get the unemployment rate down to pre-pandemic levels – which would imply delaying rate hikes as long as he possibly can (provided the supply chain issues start to clear and bring down prices):
Right now, fed fund futures are pricing in 2 rate hikes in 2022 followed by 3 rate hikes in 2023:
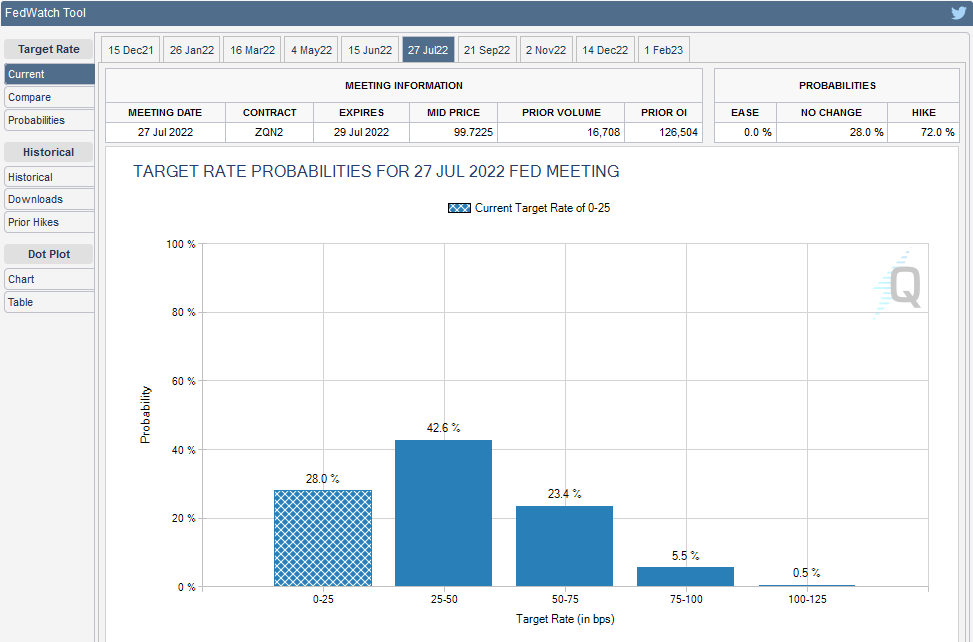
Source: CME group
If the fed fund futures are correct, they will invert the curve and cause a recession by 2023. The curve has already started to flatten materially:
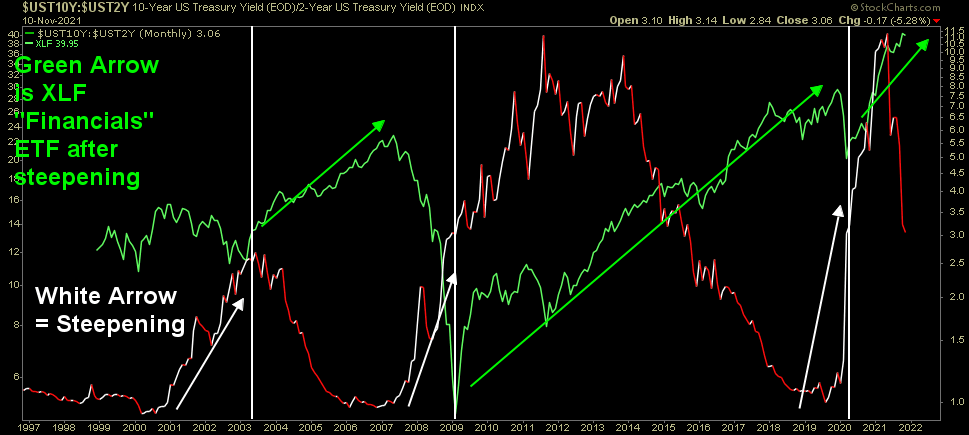
While I believe this recent move is a head-fake caused by structural de-risking from hedge funds caught off-sides and crowded to one side of the boat (everyone was short bonds), if the Fed moves too fast they will invert the curve and end the cycle too soon.
The more likely scenario (despite the pre-mature taper announcement) is that the Fed “slow-plays” rate raises and lets the curve re-steepen (and stay steep) for another couple of years before starting to end the cycle. You can see there were a couple of fake-outs early in the last cycle as well (2011 and 2012), but the curve re-steepened and stayed steep until 2014. The move toward inversion took another 5 years after that (2014-2019).
Now onto the shorter term view for the General Market:
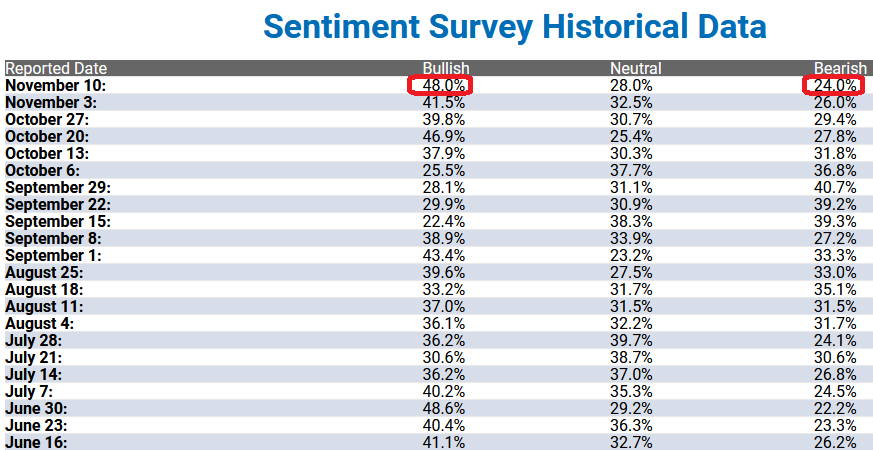
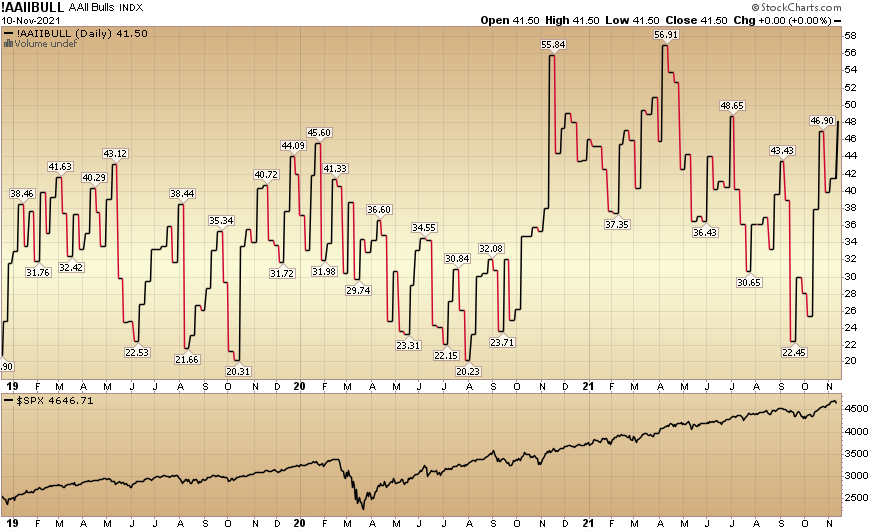
In this week’s AAII Sentiment Survey result, Bullish Percent (Video Explanation) jumped up to 48% this week from 41.5% last week. Bearish Percent ticked down to 24% from 26% last week. Retail is exuberant.
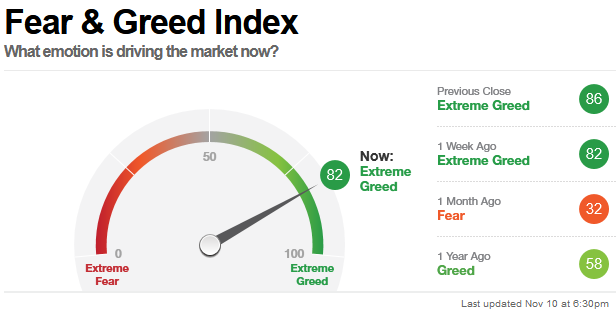
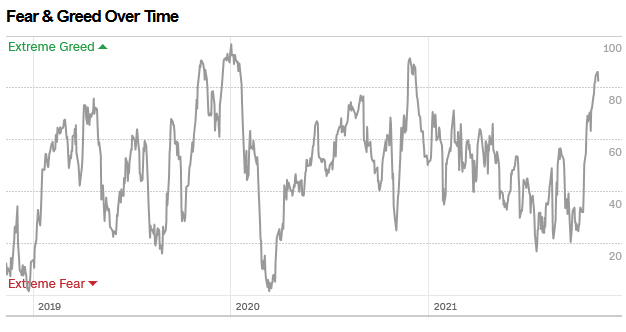
The CNN “Fear and Greed” Index flat-lined from 82 last week to 82 this week. Greed is back. You can cautiously ride existing risk (if you own reasonably valued businesses), but its not a time to add a lot of new risk/high beta at these levels. You can learn how this indicator is calculated and how it works here: (Video Explanation)
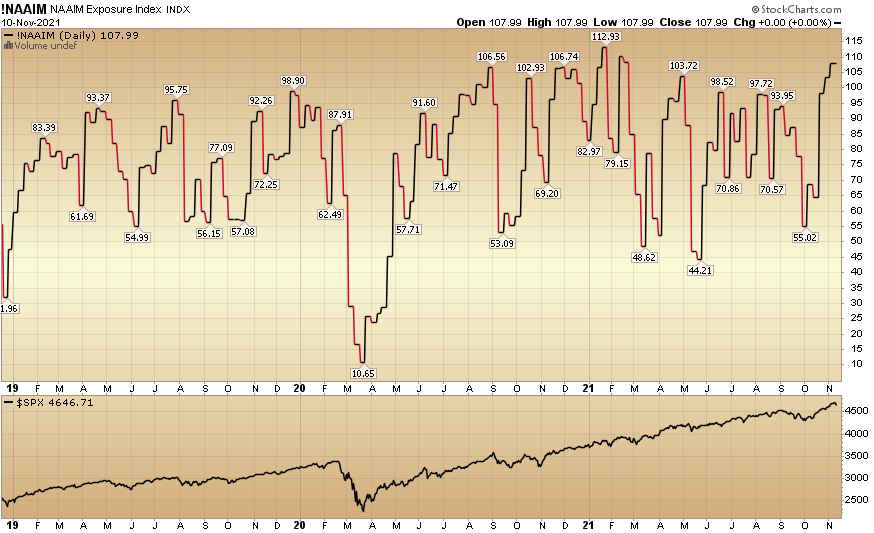
And finally, this week the NAAIM (National Association of Active Investment Managers Index) (Video Explanation) rose to 107.99% this week from 103.35% equity exposure last week. Managers continue chasing into year end – as they were underweight with the market pressing higher through earnings season.
Whether the 10yr yield moves to 2-2.5% as anticipated, or the lower probability event that yields peaked with the premature taper announcement (like 2013), it doesn’t change our view on equities for 2022.
Volatility will increase: the 3-5% corrections of 2021 will turn into 5-10%+ corrections as liquidity is slowly removed. However, until they invert the curve (2yr yield > 10yr yield) the general trajectory will be up (despite increased volatility). The volatility will just create more opportunity to capture “under the surface” sector rotation/dislocation opportunities – which is our knitting…

