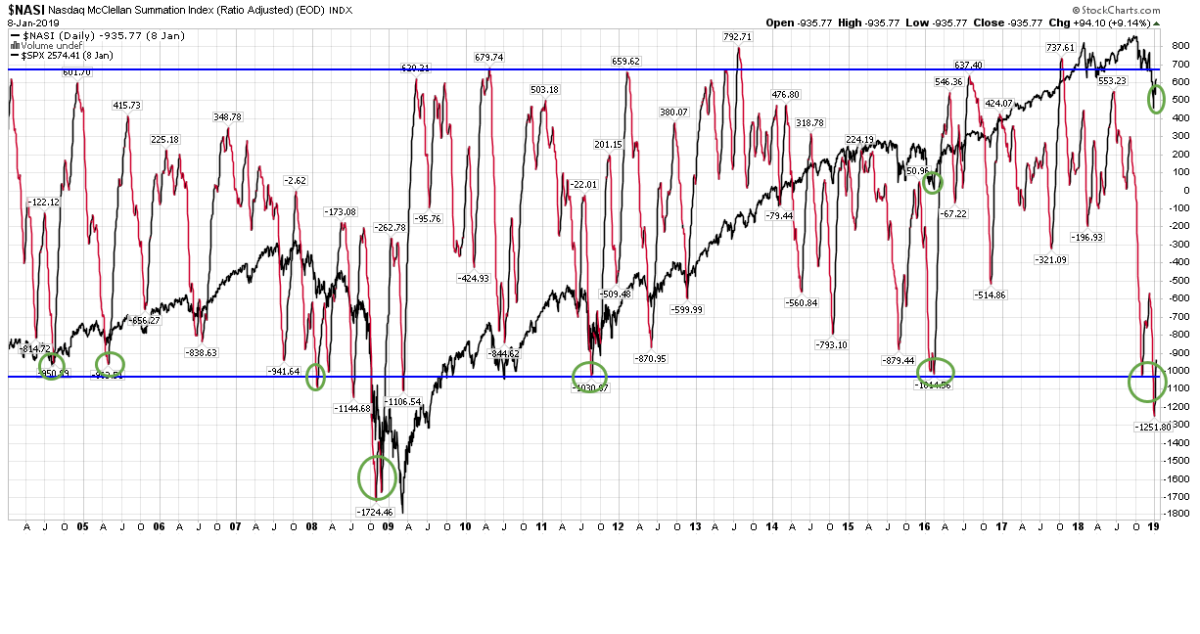
I’ve always used the Nasdaq McClellan Summation Index as a barometer for risk in the market. The McClellan Summation Index is a breadth indicator derived from the McClellan Oscillator, which is a breadth indicator based on Net Advances (advancing issues less declining issues).
This indicator does not “call bottoms” but it does give you an indication when the probabilities favor building your long book (it’s less effective as a short indicator). The attached photo shows the oscillator with the S&P 500 index in the background (in black). At this point, the oscillator seems to be leaning toward a 2011 or 2016 bottoming process followed by sustainable recovery. It’s a barometer, not a crystal ball, so earnings and guidance will matter in coming weeks, but worth noting where it is relative to what that portended in past instances.


