
Be in the know. 7 key reads for Thursday…

- The S&P 500 Will Hit 3400 by 2020 Even If Earnings Are Lower, Goldman Sachs Says (Barron’s)
- Powell Suggests Fed Embarking on 1990s-Style Mini Easing Cycle (Bloomberg)
- China sees intensive contact with U.S. this month ahead of September trade talks (Reuters)
- Powell is ‘confusing’ the markets about Fed intentions, but a new cut is expected (CNBC)
- Merck Has a Good Problem and Plenty of Options (Wall Street Journal)
- Nordstrom Family Prepares New Proposal to Increase Stake in Retailer (Wall Street Journal)
- Dr. Michael Burry Of ‘Big Short’ Likes Asian Stocks (Forbes)
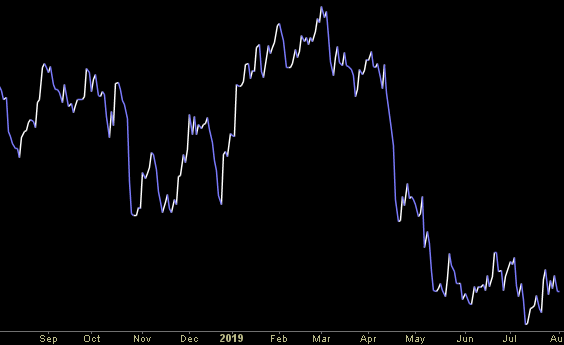
AAII Sentiment Survey Results: Getting up there…
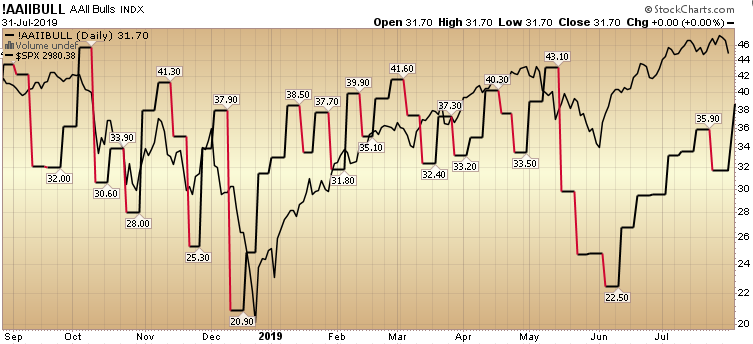
While bullish sentiment jumped in the past week from 31.74% to 38.44%, we likely still have a little room to run. This is not the level that I would be aggressively adding risk (only selectively on laggard names that haven’t participated – if at all). In the lexicon of sell side analysts we are at a “hold.” Continue reading “AAII Sentiment Survey Results: Getting up there…”
Relax, we got a ~40bps rate cut?
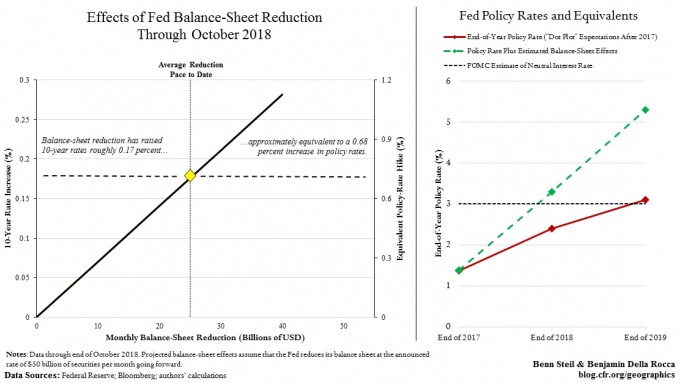
In November 2018, the Council on Foreign Relations did an article that attempted to quantify the impact of the Fed’s balance sheet runoff (Quantitative Tightening): https://www.cfr.org/blog/fed-tightening-more-it-realizes Continue reading “Relax, we got a ~40bps rate cut?”
Hedge Fund Trade Tip (PIN) – Position Idea Notification
Unusual Options Activity – Pfizer Inc. (PFE)
Today some institution/fund purchased 1,000 contracts of Jan 2020 $20 strike calls (or the right to buy 100,000 shares of Pfizer Inc. (PFE) at $20). The open interest was just 325 prior to this purchase. Continue reading “Unusual Options Activity – Pfizer Inc. (PFE)”
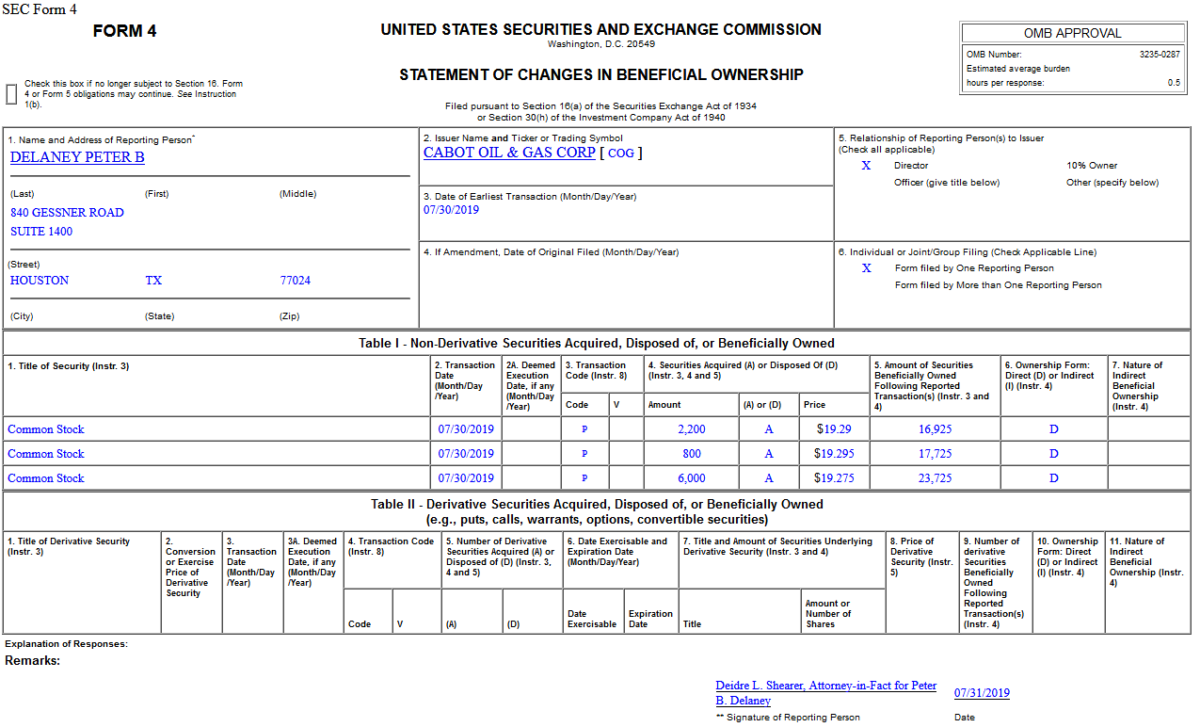
Insider Buying in Cabot Oil & Gas Corporation (COG)
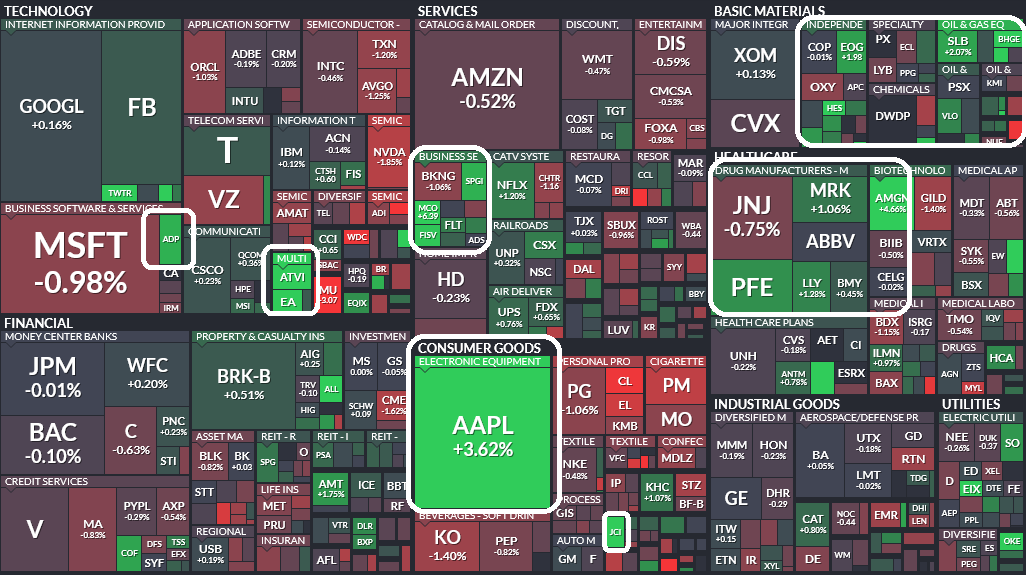
Where is money flowing today?
Financials (top 30 weights) Earnings Estimates/Revisions
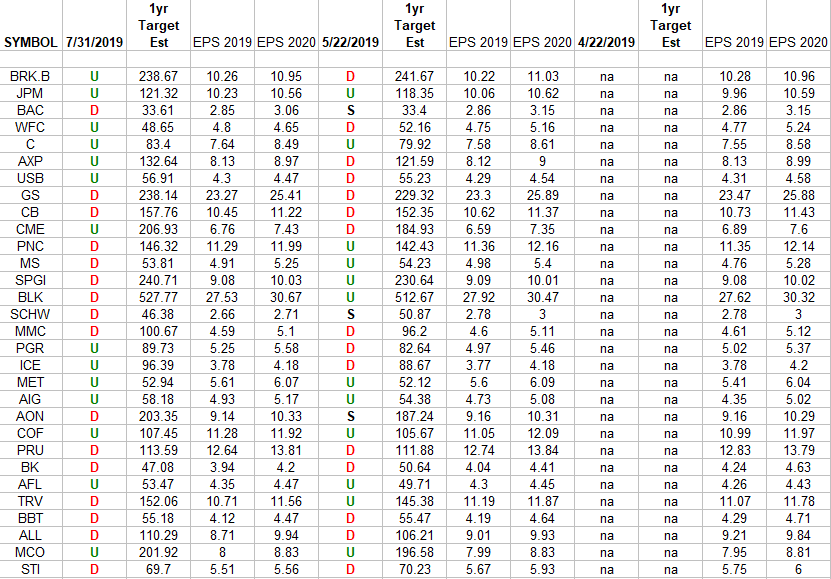
In the spreadsheet above I have tracked the earnings estimates for the Financials Sector ETF (XLF) top 30 weighted stocks. Continue reading “Financials (top 30 weights) Earnings Estimates/Revisions”
Be in the know. 12 key reads for Wednesday…

- Gilead Sciences Is a ‘Top Pick.’ Analyst Says the Stock Can Rise 40%. (Barron’s)
- Hedge Fund and Insider Trading News: Tom Steyer, Visium Asset Management, Cat Rock Capital, Central Pacific Financial Corp. (CPF), Comfort Systems USA, Inc. (FIX), and More (Insider Monkey)
- U.S. Crude Draws Should Continue Into Year-End (Seeking Alpha)
- Weekly Market Summary (The Fat Pitch)
- Gilead Sciences Beats Second-Quarter Earnings Expectations (Barron’s)
- Wells Fargo Reaps a Windfall From Old Financial-Crisis Mortgages (Barron’s)
- Apple Stock Rallies as Earnings Top Estimates, Boosted by AirPods and Apple Watch (Barron’s)
- The Undeclared Currency War: How the ECB Is Forcing the Fed’s Hand (Wall Street Journal)
- Warren Buffett: This is the No. 1 mistake parents make when teaching kids about money (CNBC)
- China Says U.S. Trade Talks to Continue With September Meeting (Bloomberg)
- The Best Ice Cream Parlor in Every State (24/7 Wall Street)
- Humana Beats Q2 Earnings Forecast as Medicare Advantage Sign-Ups Accelerate (TheStreet)