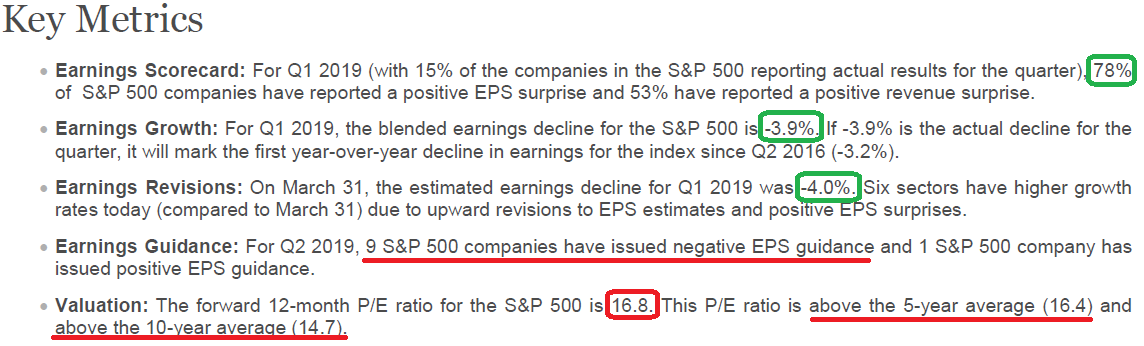
Data Source (above): Factset
Q1 earnings estimates bumped up 20bps from -4.1% last week to -3.9% this week. The 12 mo. forward multiple has expanded to 16.8x which is above the 5yr average of 16.4x and the 10 year average of 14.7x
As we stated last week, the bar is now so low that companies don’t even have to jump to get over it. They can stumble over like a drunken frat boy and still win. That’s the good news.
The bad news is that with estimates down to -3.9% for Q1 versus +2.8% on December 31, it is unlikely that earnings will be flat for Q1 – even after they beat. They will most likely be slightly negative year on year.
Smart folks will say, “that’s priced in – it’s all about guidance.” I agree, to an extent. So far the Negative Guidance:Positive Guidance ratio is 9:1 (negative) for the S&P 500 (from the 10 components that have reported). Where I’m particularly cautious is if we get another sequential drop (Q4 2018 vs. Q1 2019) in OPERATING earnings (versus ‘as reported’).
Data Source (below): Howard Silverblatt – S&P Global
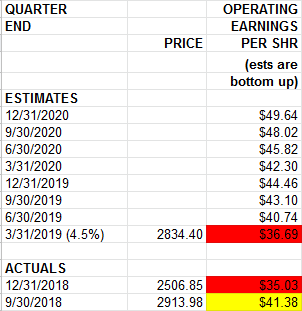
The significance of this is that it would signal a deterioration in the underlying economy last seen only in late 2007 and 2000. As you can see, we have a $1.66 “margin of safety” (down from $1.79 “margin of safety” on 4/10/19) against this happening on Operating Earnings (difference between Q4 2018 final – $35.03 and Q1 2019 est – $36.69).
The difference is that while “as reported” earnings tend to beat by ~3% (improving as earnings season unfolds), “operating earnings” have recently DROPPED as the reporting period progressed. For example, operating earnings estimates for Q4 2018 were estimated at $38.82 with just four weeks left of reporting in early March and they finished out $3.79 LOWER by the end of the Q1 reporting season last week (for a 15.34% sequential drop from Q3 2018-Q4 2018).
So while it is not our base case that we will get a second sequential drop, it is now well within the realm of possibility. Whether that yields an outcome similar to 2007/2000 periods when this last happened is to be determined, but I would err towards “unlikely” as the pressure will be on for the fed to ease.
Furthermore, the 2/10 part of the curve has not yet inverted (stock market peaks are usually ~1.5yrs AFTER 2/10 inversion, so the countdown clock has not even started). The 2/10 had been inverted for almost 2 years prior to the double sequential operating earnings drops in 2007 and 2000.
I covered these subjects extensively in this recent article. You can read about the bull case and bear case in detail here:
UPDATE (newest data): Bull vs. Bear Death Match: Why Q1 Operating Earnings are “Make or Break”