This week we chose AC/DC’s 1990 Billboard Hit, “Thunderstruck” to capture current stock market sentiment. On Friday, we got a tremendous miss with the Jobs Report coming in at +235K jobs versus +750k estimated.
As we said on our Cheddar appearance last Monday, we expected this miss – and that it would lead to a delay in Taper implementation. As anticipated, lightning struck, and the thunder followed leading to three consecutive down days in the general indices:

Thunderstruck, thunderstruck
Yeah, yeah, yeah, thunderstruck, thunderstruck
Yeah, yeah, yeah, said, yeah, it’s alright, we’re doin’ fine
Yeah, it’s alright, we’re doin’ fine, fine, fine…
On Tuesday afternoon I was on Yahoo! Finance with Seana Smith. Thanks to Seana, Taylor Clothier and Josh Schafer for having me on. In this segment we discussed our Fed Outlook, re-opening trade, the impact of the taper on markets moving forward, and a few stock picks:
Click Here to Watch HD Version Directly on Yahoo! Finance
Here are the key show notes (along with charts for visual representation):
Taper Impact is the name of the game moving forward.
Comparing 2013 “taper tantrum” to 2021 “taper signaling” for clues on what we might expect in coming months:
10yr yield went from ~1.61% when they signaled (May 1, 2013) to 2.92% (Dec 18, 2013 when they announced the beginning of taper – reducing bond purchases from $85B/mo to $75B/mo). The anticipation of the taper was worse than actual taper (for yields) because the day they started was the peak in rates. The 10yr yield briefly touched over 3% 13 days later but that was the peak in rates until 2018.
We will likely see a similar move in coming months to rates (10yr yield) over 2% before peaking once taper is finally announced/implemented in/around early 2022.
Here is a timeline of events:
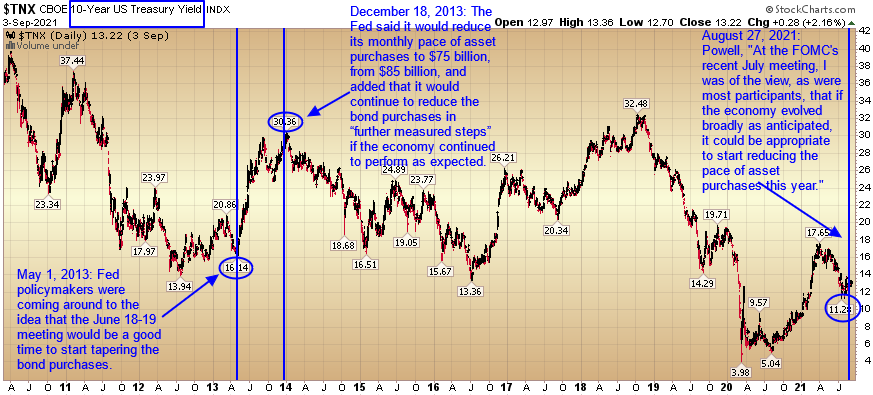
APRIL 30-MAY 1, 2013 POLICY MEETING
Some Fed policymakers were coming around to the idea that the June 18-19 meeting would be a good time to start tapering the bond purchases, though it was not known publicly at the time.
Powell was among them, arguing the Fed should take “the next reasonable and plausible opportunity to taper.”
Unemployment in March was 7.5 percent, core PCE inflation was 1.5 percent and the Fed’s bond portfolio was at $3.04 trillion.
No change to policy was made.
The next 4 policy meetings they punted on taper, then finally:
DEC. 17-18, 2013 POLICY MEETING
After more than a year of debate, the Fed took its first small step toward unwinding the controversial stimulus.
The Fed said it would reduce its monthly pace of asset purchases to $75 billion, from $85 billion, and added that it would continue to reduce the bond purchases in “further measured steps” if the economy continued to perform as expected.
Unemployment in November was at a five-year low of 6.9 percent, core PCE inflation was 1.6 percent, and the Fed’s bond portfolio was nearing $3.75 trillion.
Market Overview:
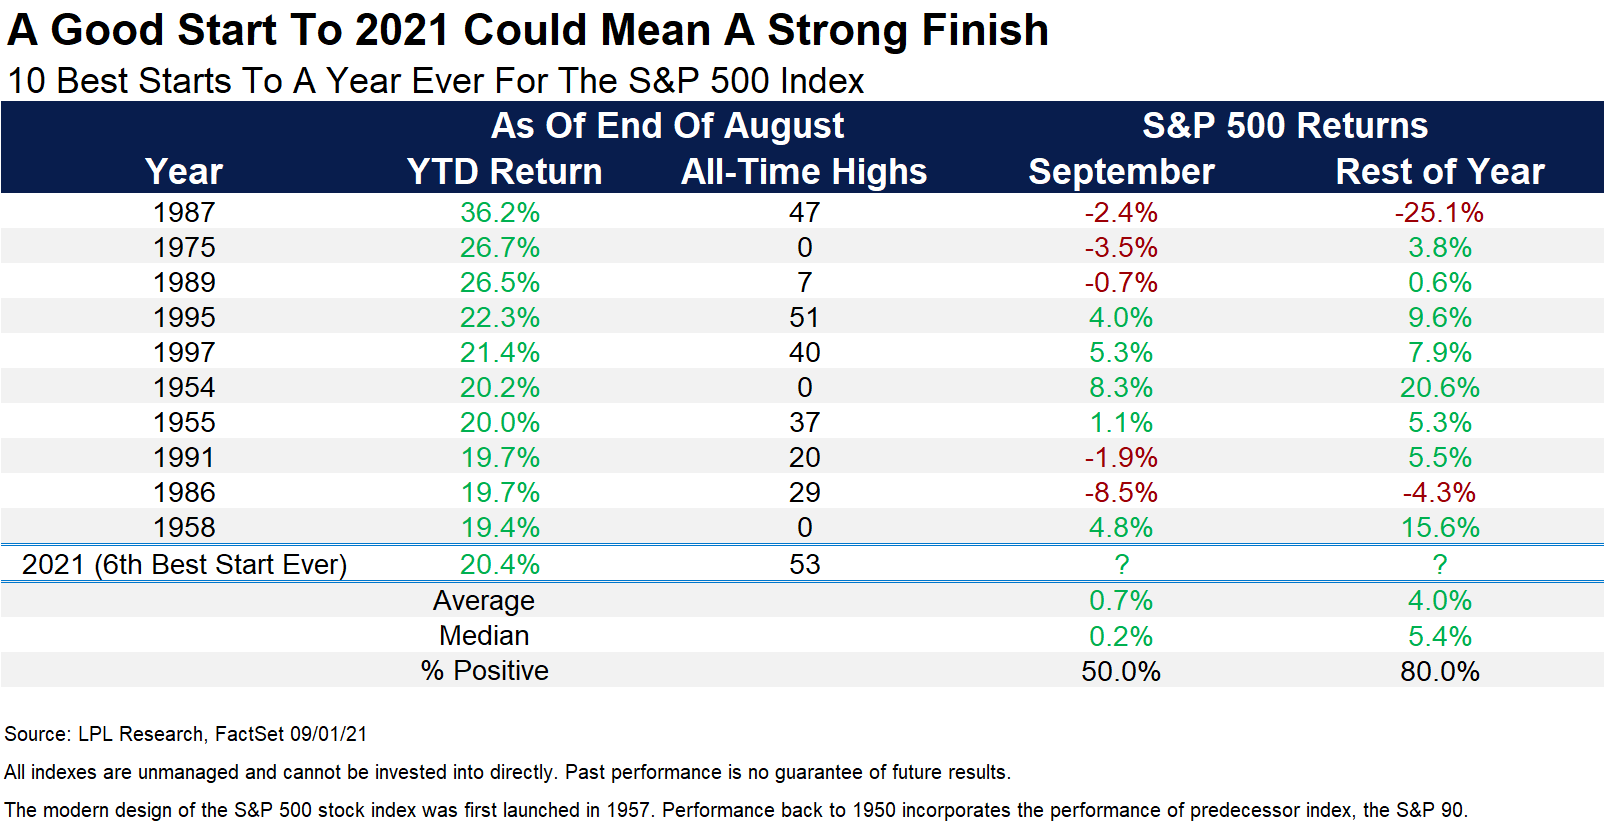
Fastest doubling of S&P in history. 54 all-time highs in 2021. Many looking at this as a reason to crash. History shows that strength begets strength and not to expect major weakness until Fed pulls the punch bowl away (early next year).
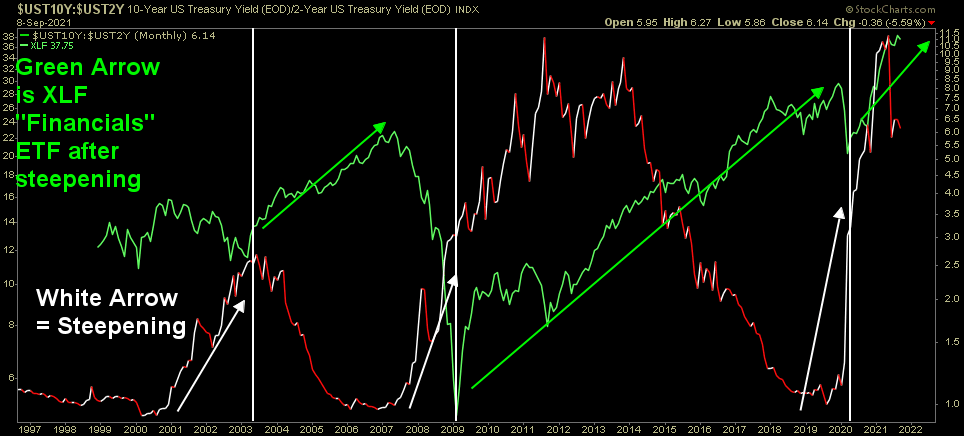
You don’t get a recession (major crash) until after the yield curve inverts (2:10 yr yield ratio dips below 1), and right now we are still steep (2s/10s) and that should continue through taper and even in early stages of rate rises.
FED:
The Fed has announced they want to start taking the punch bowl away (in Jackson Hole), but it’s like the bartender who turns up the lights at 2am but keeps serving liquor.
“Substantial Further Progress” standard has been met on inflation.
“Progress” (but not “Substantial”) has been made employment.
Powell continues to emphasize Full Employment as his top priority (over inflation). Considering there are 8.4M still unemployed versus 5.7M (pre-pandemic Feb 2020), while he may begin tapering in 2021, it is unlikely after Friday’s jobs report.
Estimates for Friday were +750k jobs and came in at an abysmal 235k. 5.2% current unemployment rate versus 3.5% in Feb 2020.
Even if tapering is announced in November (and implemented before year-end), it will still be a long way off until rate raises (earliest late 2022). His emphasis was on separating the 2 policy actions as distinct.
Reasons for Continued Strength in Stock Market:
-Earnings are strong: 2020 estimates have gone from ~$200 to almost $220 in the last handful of months. They could exceed $230 before end of year. If we retain the 22x multiple that takes 12 month targets up to 5060 on the S&P which is in the range of what we are seeing from UBS, CS, and GS strategists.
Trades. Focused on “Re-Opening” trades as rates are likely to rise AHEAD of actual tapering (like 2013). Rising rate environment favors a move BACK to cyclicals/re-opening trades like Q4 2020 and Q1 2021. Future “promised” long-duration Tech earnings become less valuable in the present when discount rate increases.
BA: We like Boeing as a re-opening trade as the 737Max was just approved to fly again a week ago in India and is in the approval process in China. We also like its exposure to defense moving forward. We think this is a $300+ stock over the next 12-18 months as global vaccination rates climb and pent up business and leisure travel returns and well as demand for defense portfolio increases.
CI: Trading at 9.6x next year’s earnings compared to its avg. historic multiple of 12x. Pays 1.84% while you wait. Stock down on short term increase in MCR (medical care ratio) to 85% from 80% due to COVID treatment/testing. Will normalize in coming quarters. Pharmacy business (Evernorth) booming as script volumes up 13% now that people returning to doctor visits. We think this works back up to new highs over the next 6-12 months.
EOG: Trading at 8.4x next year’s earnings compared to its avg. historic multiple of 20x. Pays 2.43% while you wait. EOG is among the most technically proficient operators in the business. Initial production rates from its shale wells consistently exceed industry averages. Its most lucrative assets are located in the Permian Basin and the Eagle Ford.
Last Thursday evening we were on Channel NewsAsia (CNA) “First Asia” show where we not only covered the general market overview, but answered some questions on Oil and the US Dollar. Thanks to Marianne Star Inacay, Henry Yin and Olivia Marzuki for having me on:
Now onto the shorter term view for the General Market:
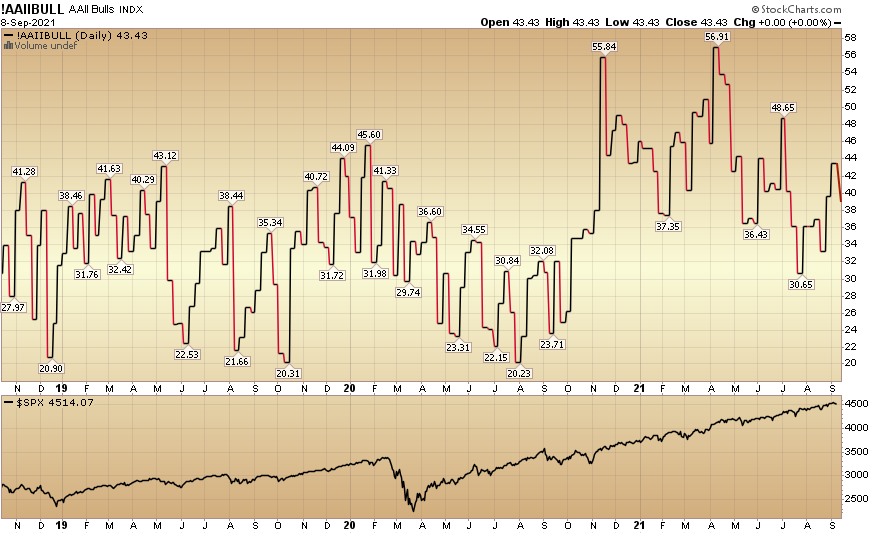
In this week’s AAII Sentiment Survey result, Bullish Percent (Video Explanation) rose to declined to 38.9% from 43.4% last week. Bearish Percent declined to 27.2% from 33.3% last week.
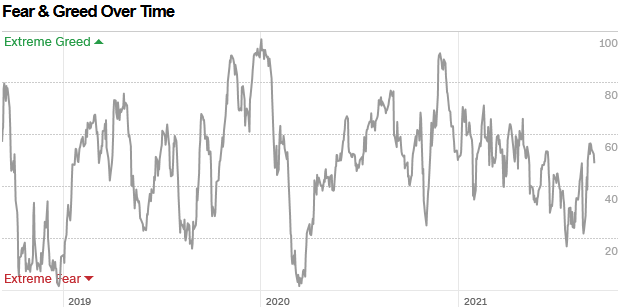
The CNN “Fear and Greed” Index declined from 57 last week to 49 this week. This is a neutral read. You can learn how this indicator is calculated and how it works here: (Video Explanation)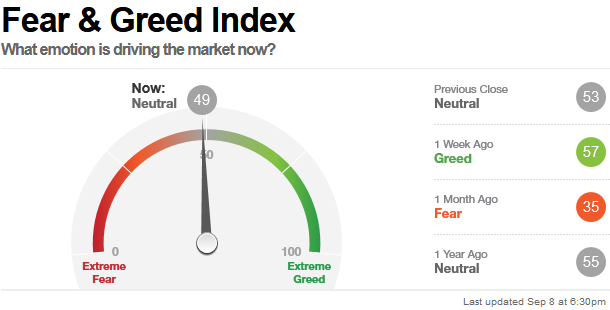
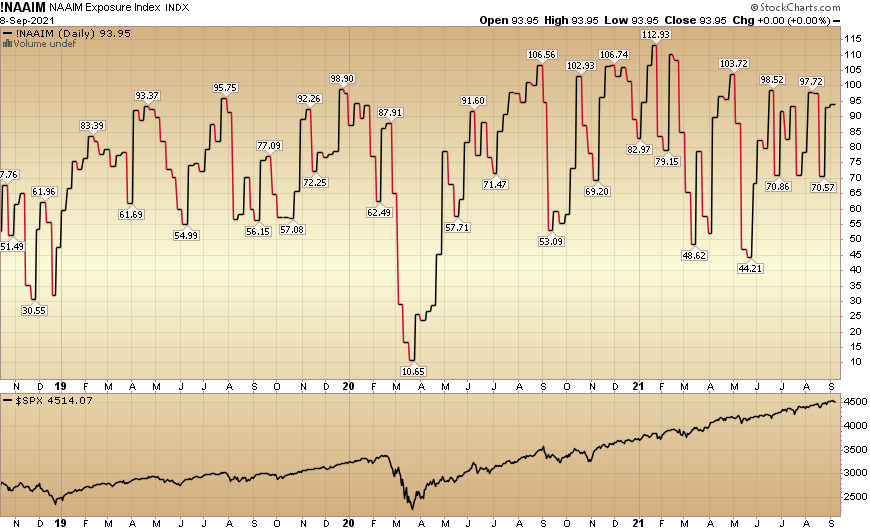
 And finally, this week the NAAIM (National Association of Active Investment Managers Index) (Video Explanation) flat-lined at 93.95% this week from 92.83% equity exposure last week.
Yesterday, Ryan Detrick of LPL put out the following chart of historic data to support our view that “strength begets strength” (until the Fed takes away the punch bowl). Liquidity is the name of the game, and don’t be surprised if we get a positive outcome for the next few months for the general indices – coupled with a superlative opportunity in the stocks that have been left behind in recent months.
As we said last week, while everyone debates whether we are going to have a “September Swoon” or not, take a step back and look for sectors/stocks that have already had a “Summer Swoon” and buy the quality stocks that are on sale. The lightning came on Friday, the thunder followed, and we believe the sunshine may show up in places where few are looking of late…


