For anyone who has watched the Nasdaq and Chinese Stocks since the beginning of the year, the lyrics (in Masked Wolf’s “Astronaut in the Ocean”) that best describe their movement (floating action/little progress) are as follows:
Let’s just get this straight for a second, I’ma work
Even if I don’t get paid for progression, I’ma get it (get it)
Everything that I do is electric
I’ma keep it in a motion, keep it moving like kinetic, ayy (yeah, yeah, yeah, yeah)
The Nasdaq (QQQ ETF) is up just over 6% ytd while the China ASHR (A-Shares) ETF is also up modestly at just over 3% ytd.
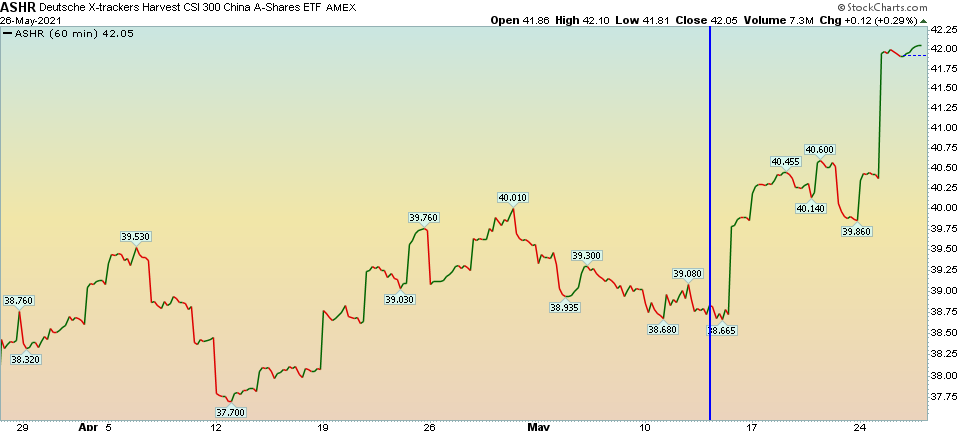
Since we put out our article advocating for new selective exposure in Tech/SaaS and China stocks on May 13, both groups have started to move:

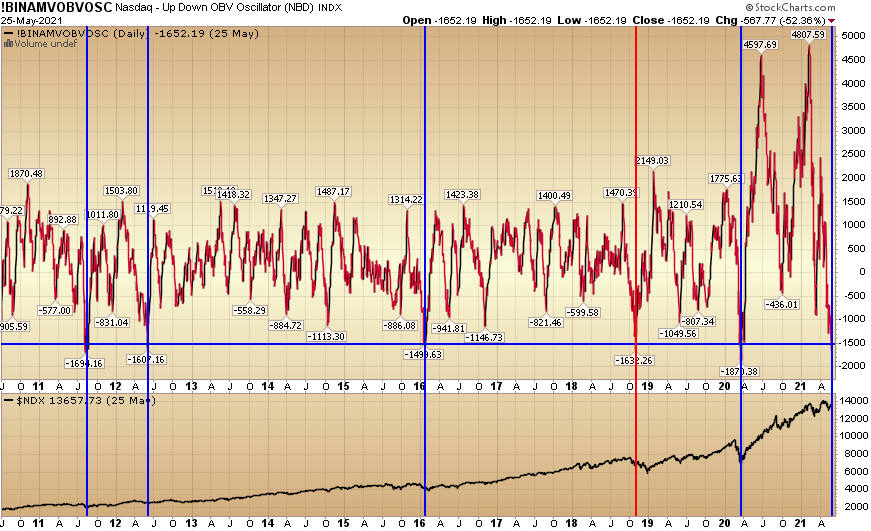
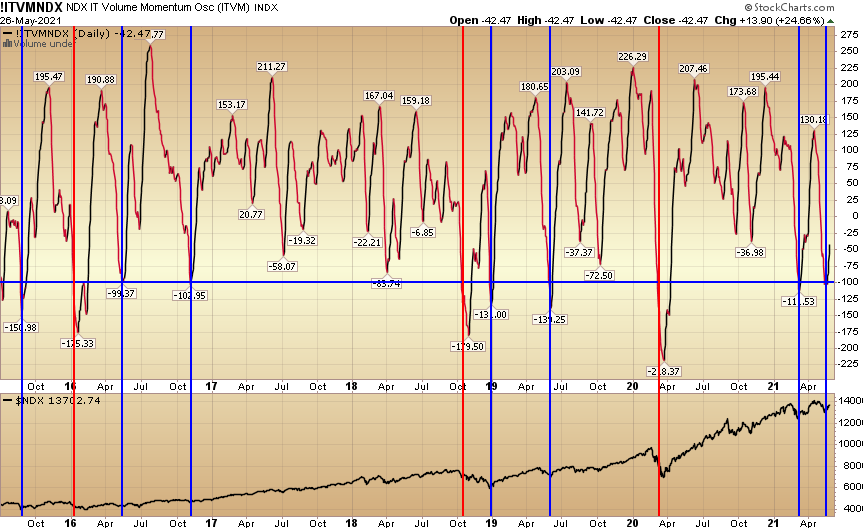
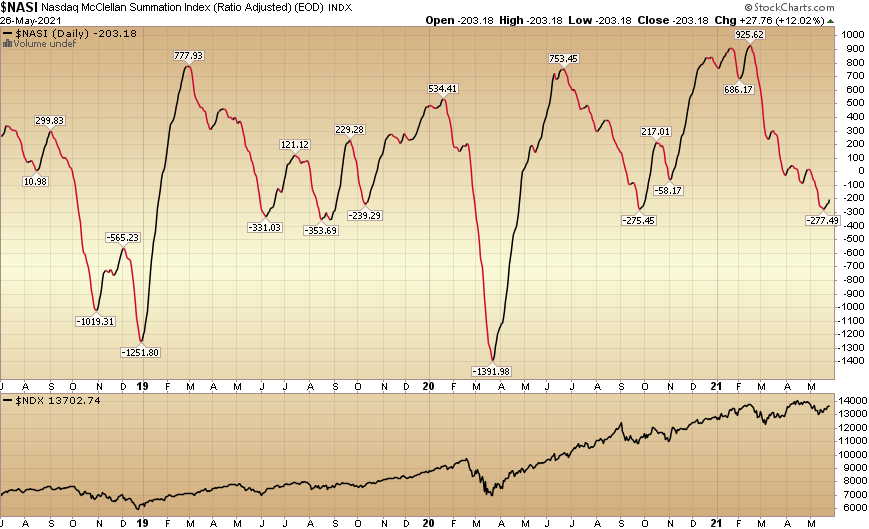
 A few of the 10 turn point indicators we laid out for the Nasdaq in that article are still indicating that we may be closer to the beginning of this bounce than the end.
With that said, we have continued to put NEW money into selective Chinese stocks and Tech/SaaS stocks in the past two weeks. Where available, we added in existing accounts to the positions we discussed over the past two weeks’ VideoCast/Podcast episodes.
On Tuesday afternoon I was on Fox Business – The Claman Countdown – with Liz Claman. Thanks to Liz and Ellie Terrett for having me on.
In this segment we discussed which re-opening stocks still looked good here – even after the ~90% move off the March 2020 lows. I cover three key names that we believe a significant portion of the upside is not yet priced in. You can find the three names here (with explanation):
On Tuesday evening I was on CGTN America – with Elaine Reyes. Thanks to Elaine and Stephanie Savage for having me on.
In this segment we discussed the 3 key reasons that Chinese stocks fell so precipitously in the few months prior to my May 13 article, and where the opportunity lies moving forward. You can watch it here:
Adding to the optimism around these two specific groups, there is cause for tempered optimism as it relates to a “general indices” summer rally.
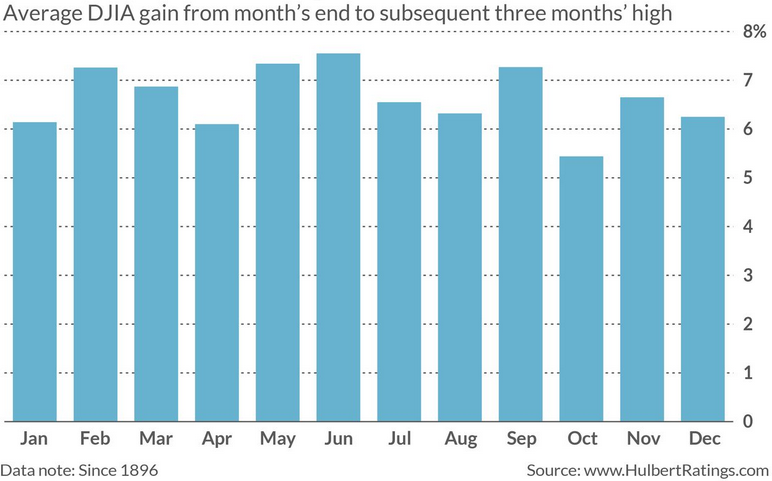
According to data collected by Mark Hulbert, since its creation in 1896, the Dow Jones Industrial Average DJIA, at some point in June, July or August has been 7.34% higher on average than where it stood at the end of May:
Now onto the shorter term view for the General Market:
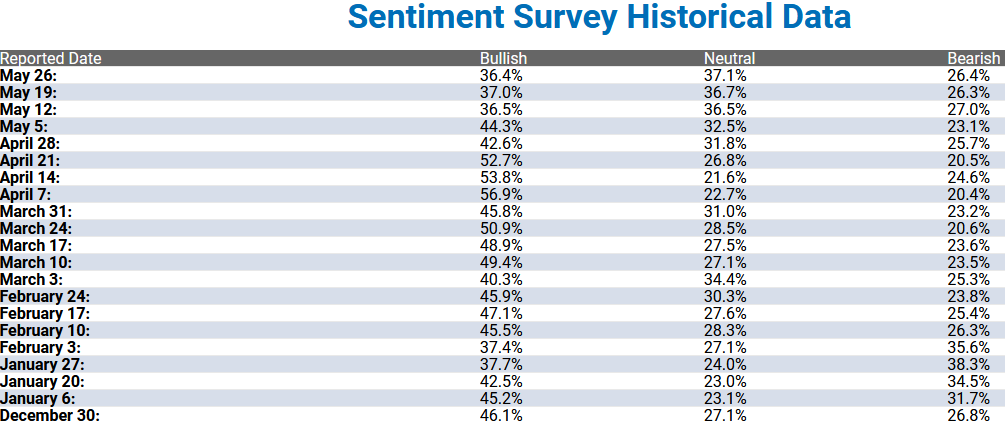
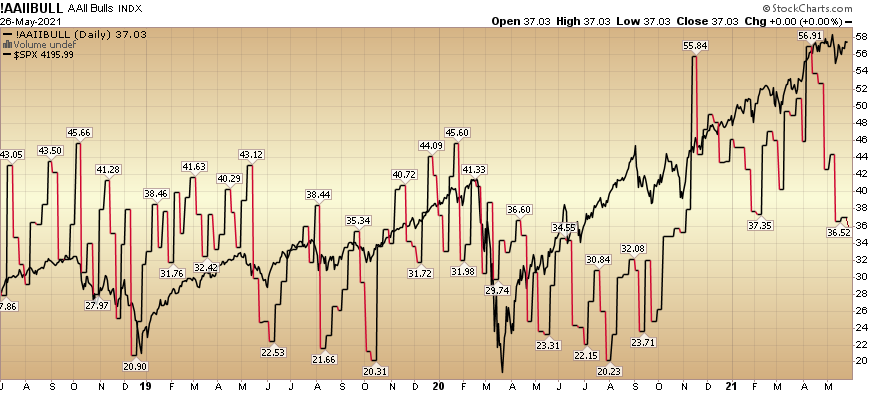
In this week’s AAII Sentiment Survey result, Bullish Percent (Video Explanation) inched down to 36.4% from 37% last week. Bearish Percent flat-lined at 26.4% from 26.3% last week.
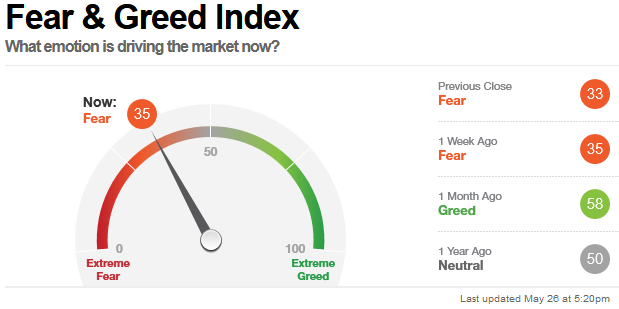
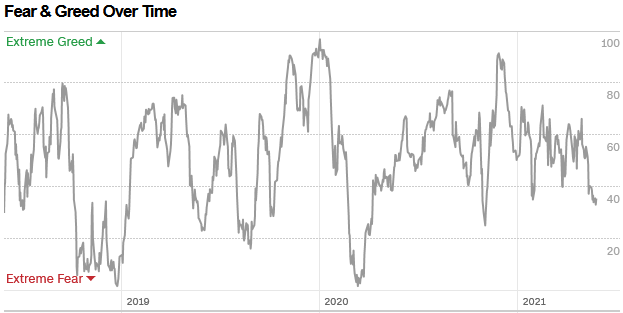
The CNN “Fear and Greed” Index flat-lined from 35 last week to 35 this week. Fear is here. You can learn how this indicator is calculated and how it works here: (Video Explanation)
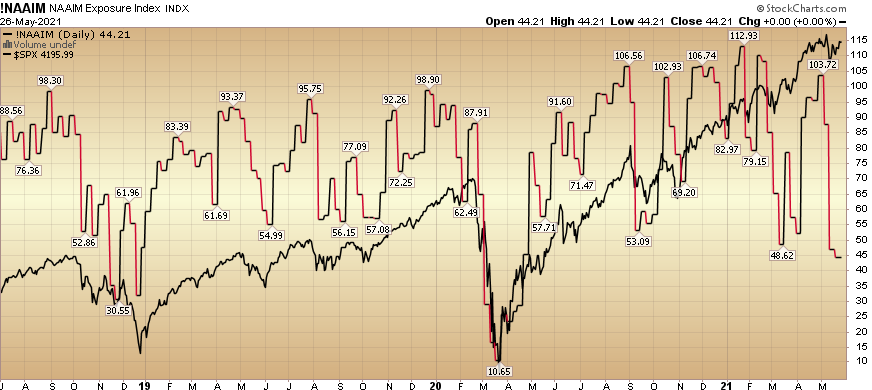
And finally, this week the NAAIM (National Association of Active Investment Managers Index) (Video Explanation) dropped to 44.21% this week from 46.86% equity exposure last week. A bounce at these levels will force these underweight managers to chase very quickly.
Our message for this week:
We continue to pick our spots and look for the “rallies under the surface.” We have spent the last couple of weeks building China positions, selected SaaS/Tech positions, and SPAC warrants (mostly selective “busted” SPACs with announced deals that have rolled over – but have interesting businesses/sponsors for the long-term). You can explore a list of completed SPACs here.
We continue to buy where we see dislocation (as discussed in the two video segments above) and don’t expect much from the general indices. We believe the “big money” will be made “under the surface” for the rest of the year.
So while the indices may float around like an “Astronaut In The Ocean,” we continue to scoop up bargains (and then patiently wait) to push the equity curve to new highs.


