My wife and I have been big Grace Potter fans since “accidentally” seeing her live at Bryant Park in 2010 when we were walking past a special outdoor concert she did that night (4 or 5 concerts later, here we are!). If you’re not familiar with her music, she has been doing free live streaming shows every Monday night during the quarantine. But for now, here are this week’s salient lyrics as it applies to our analysis:
Things ain’t bad but things ain’t right
Are we falling or flying?
Are we falling or flying?
Are we living or dying?…
The room was dark but the stage was bright
Are we falling or flying?
Are we falling or flying?
Are we living? Are we dying?
’cause, my friend, this too shall pass
So play every show like it’s your last…
On Tuesday I was on Yahoo! Finance for Seana Smith’s show, “The Ticker.” In the segment below I parsed out the confusion in the markets and how I expect it will resolve itself through broadening participation (of laggard sectors) over time, and partial sector rotation. You can see which four sectors/sub-sectors I am focused on here (and why):
In last week’s note, we laid out the case for why the market swooned ~6% in a matter of a couple of days and how it came back. We discussed the “Four Horseman of the Apacalypse” here:
The Thomas Rhett “Beer Can’t Fix” Stock Market (and Sentiment Results)…
In the note above I highlighted one of the “horseman” named David Tepper. Tepper is a legendary Billionaire Hedge Fund Manager with an exceptional long term record. When he talks, the market listens. What he pointed out was an argument we made a few weeks ago regarding the top 5 weights of the S&P 500 making up ~25% of the index weighting. While he said these names were the 2nd most overvalued in his career (second to 1999-2000), he also said it was likely the bottom was in for the general market.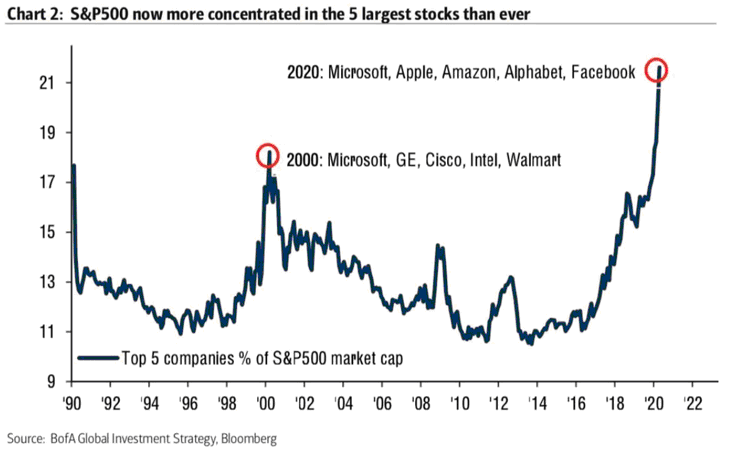
I generally agree, so then if we are to climb higher (the wall of worry) or at least maintain a sensible range to digest the large gains off the March 23 bottom, where will the power come from?
This week I put out a summary of Bank of America’s Global Fund Manager (monthly) Survey. It chronicles the survey results of ~200 managers running ~$600B of AUM. You can view it here:
May Bank of America Global Fund Manager Survey Results (Summary)
Historically, it has paid to take the other side of trades that tend to be excessively crowded (with minimal marginal buyers or sellers). Meaning, so many people are on one side of the boat for a particular asset class (either short or long) that with no extra marginal players – the tendency is reversion and/or complete reversal.
The key responses to this month’s BofA survey – as we think about positioning moving forward – are:
- Only 10% believe this is a V-shaped recovery.
- Managers are worried that stocks are in a ‘bear market rally’ that could fade quickly in the face of a second wave of coronavirus infections.
- BofA’s Bull & Bear Indicator is still pinned at zero (a contrary buy signal).
- Cash levels (5.7%) remain well above the 10-year average of 4.7% (contrarian buy signal).
- Bond allocation was the highest since July 2009.
- Holding record longs in healthcare stocks.
- Managers see value stocks as the worst group in the current climate. A net 23% expect the group to outperform their growth counterparts, the lowest level in ~13 years.
- Investors are underweight cyclical assets (energy, industrials, Europe).
- Investors are overweight defensive assets (health care, cash, bonds).
- U.S. tech and growth stocks are the “most crowded trade.”
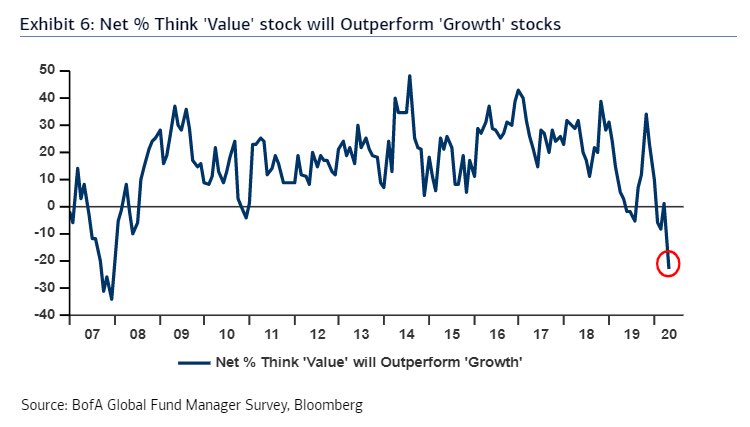
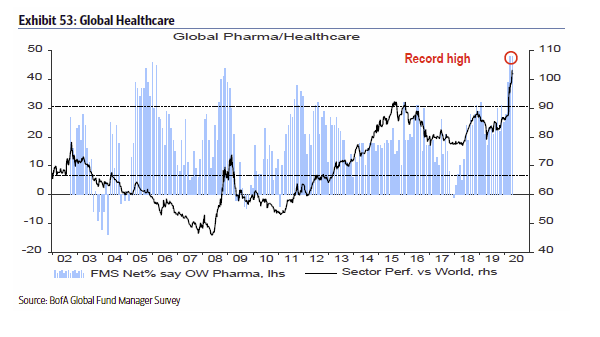
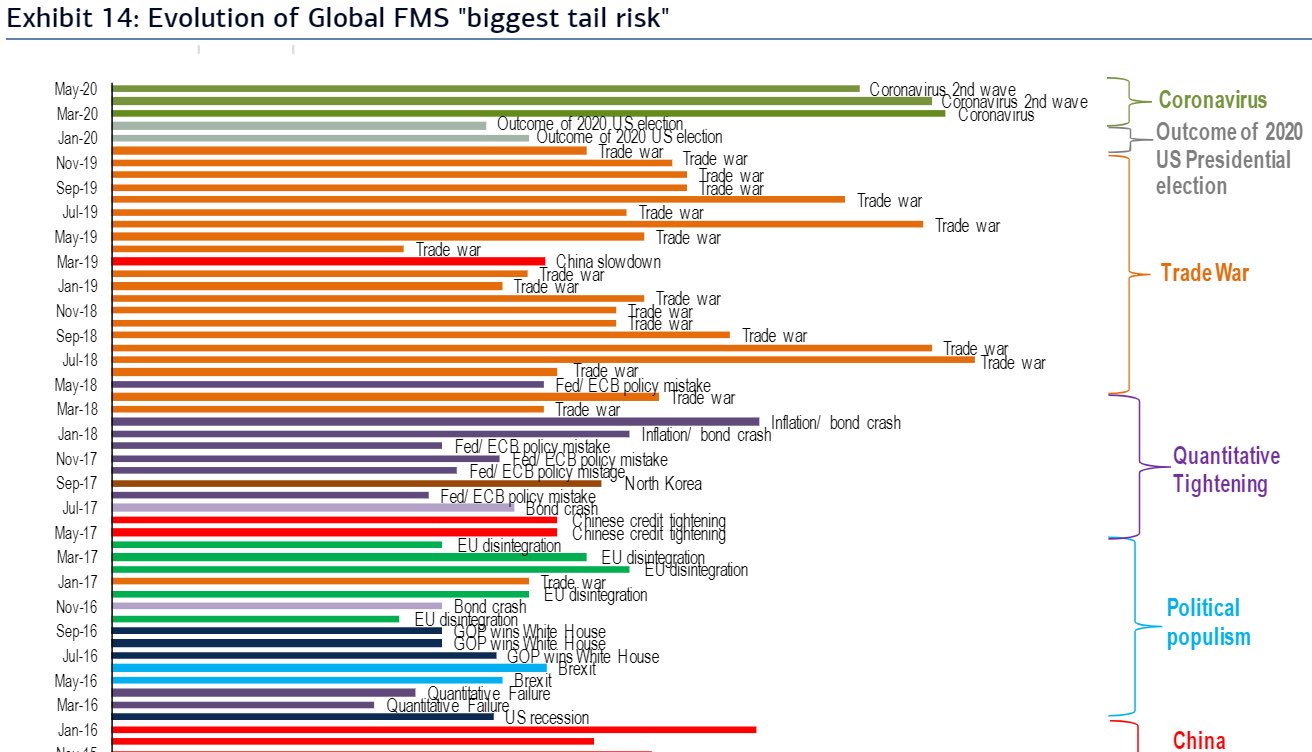
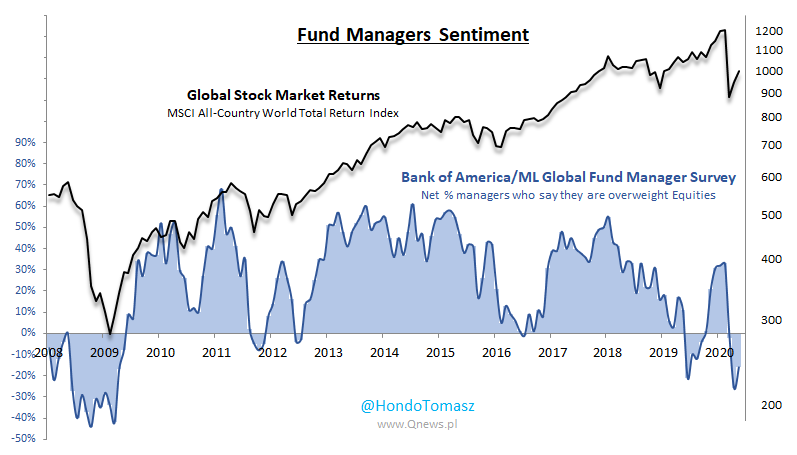
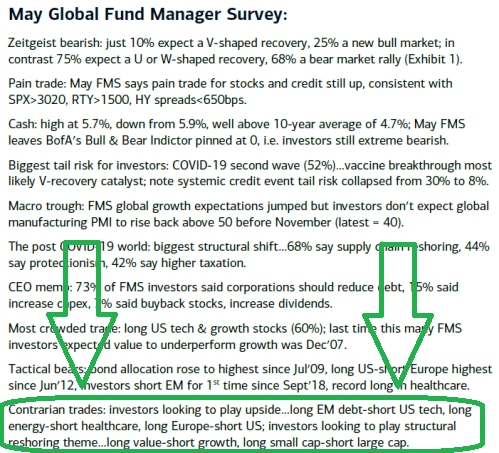
The key takeaway is that positioning remains excessively defensive with the exception of U.S. Tech (despite a ~35% rally off the March 23 spike lows). As money is forced into the market, institutional managers will look to laggard value sectors to gain exposure (and try to play catch up), while retail will chase new highs. The difference is institutions take a longer view and need time to accumulate a sizeable position over weeks (if not months).
Looking out over the next 6-18 months, for the rally to persist (and the lows to be in), we will need to see a broadening of participation (beyond the 5 or so top weighted stocks that are in David Tepper’s words, “Fully Valued”).

Like Gretzky, we want to skate to where the puck is going, not to where it is. The core question will be, does a rotation into laggard sectors have to be at the expense of the most crowded trade (Tech/Growth), or can it be in concert (with a relative out-performance as money flows into cyclicals)?
Only time will tell, but the risk:reward for skating to where the puck is going is attractive at this moment. Another factor that could catalyze this move would be persistent initiatives/headlines like this: “Justice Department and State AGs likely to file antitrust lawsuit against Google.”
We’ve put money to work in Banks, Defense Stocks, Home Builders, Energy and Small Caps to take advantage of what we believe will be an attractive reward coming out of this recession.
Q2 will be the 2nd quarter of negative GDP growth, so by they time they declare the “recession” after Q2, the stock market will already have discounted the recovery and cyclicals historically outperform coming out of recessions – as rates tick higher from emergency levels – slowly over time.
Bank Catalysts:
- Comprehensive Capital Analysis and Review (CCAR) for major banks is due out in the next couple of weeks.
- Fee Income will be higher than anticipated for Q2. PPP origination fees exceeded $10B in aggregate to banks from Phase 1, and will likely exceed that amount for Phase 2 given the average loan size is smaller (smaller loans receive 5% origination fees relative to 1% for the largest size loans).
- Fee income will offset higher loan loss provisions due to coronavirus.
- Default risk: The Main Street Lending program between the Fed/Treasury, that will support larger companies (to the tune of up to ~$3T), will go a long way to mitigate the magnitude of expected default risk at the beginning of this crisis. TALF will help to mitigate bank risk on the credit card, auto and student debt side, as well as corporate and commercial mortgage debt.
Defense Stock Catalysts:
- The Trump administration moved to block foreign chip makers using U.S. software and technology from shipping products to Huawei without a license. While I do not expect this to escalate into another trade war (or Cold War) – as the Chinese are still making purchases consistent with the agreed trade deal, the tough rhetoric moving forward will bring attention to how undervalued this sector has become.
- Rhetoric has also ticked up on costs/culpability for coronavirus.
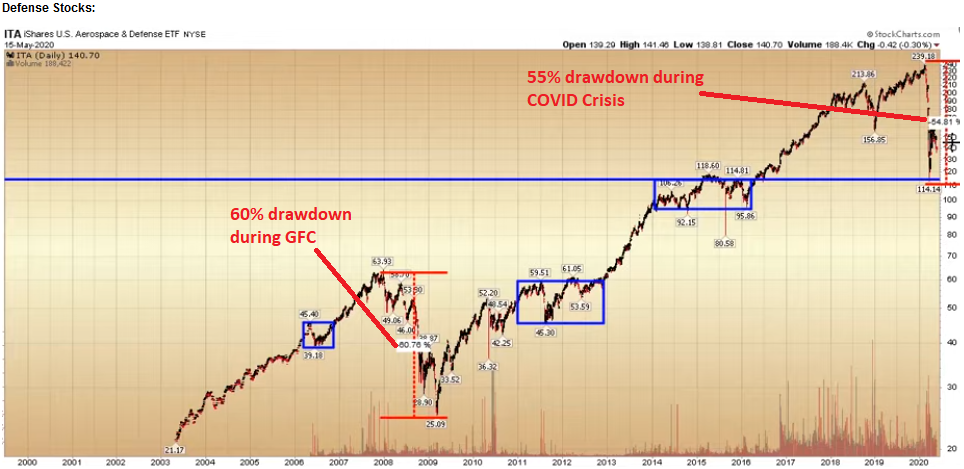
- During the GFC, Defense stocks fell by 60% peak to trough. This cycle they fell 55%.
Home Builders Catalysts:
- 85M millenials started housing formation prior to COVID. The virus will accelerate this move to the suburbs (we are down to 1-2 months of inventory). This movement is larger than the 80M Baby Boomers who drove the economic bus/housing formation/bull market from 1982-2000.
- Pulte reported earnings last week and noted that new home orders jumped from 140 to 400 new homes in the past month. The worst is in the rear view mirror.
- Confidence in the market for single-family, newly built homes rose 7 points to 37 in May, according to the National Association of Home Builders/Wells Fargo Housing Market Index.
- Mortgage applications to purchase a home rose 6% last week from the previous week.
- Purchase volume was just 1.5% lower than a year ago despite COVID-19.
Energy Catalysts:
- Rig Count down from 1600 (Dec 2014 peak) to ~300 today. Low prices cure low prices.
- OPEC Cuts: 9.7M bbl/day May/June 2020. 7.6M bbl/day July 2020 – Jan 2021. 5.6M bbl/day Jan 2021 – Apr 2022. The Saudis just added another 1M cuts to May – taking total to 10.7M bbl/day cut in May.
- Demand returning: Chinese oil demand is almost back to pre-pandemic crisis levels at ~13M bbl/day (up from 10M bbl/day trough in February).
Now onto the shorter term view for the General Market:
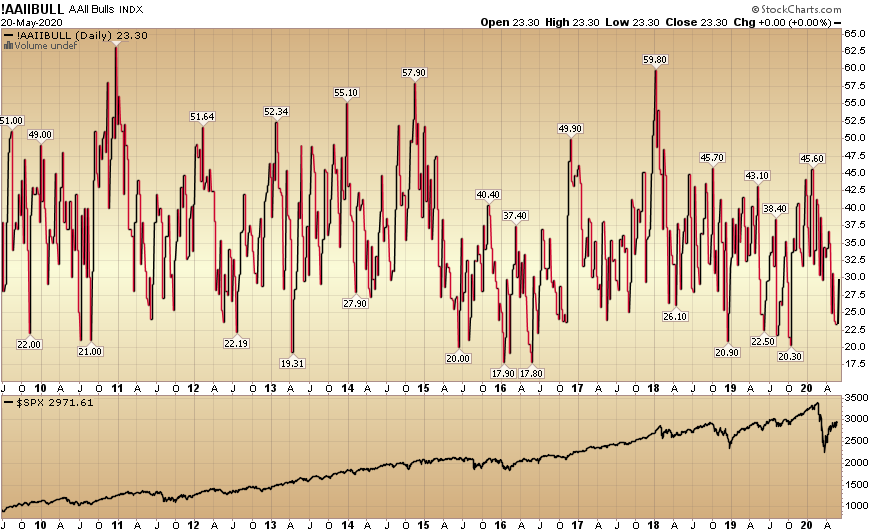
This week’s AAII Sentiment Survey result Bullish Percent (Video Explanation) jumped to 29.00% from 23.31% last week. Bearish Percent fell to 45.02% from 50.61% last week. Fear is finally thawing for individual investors, but there are no signs of euphoria yet. The market continues to consolidate its big gains off of the March 23 low. 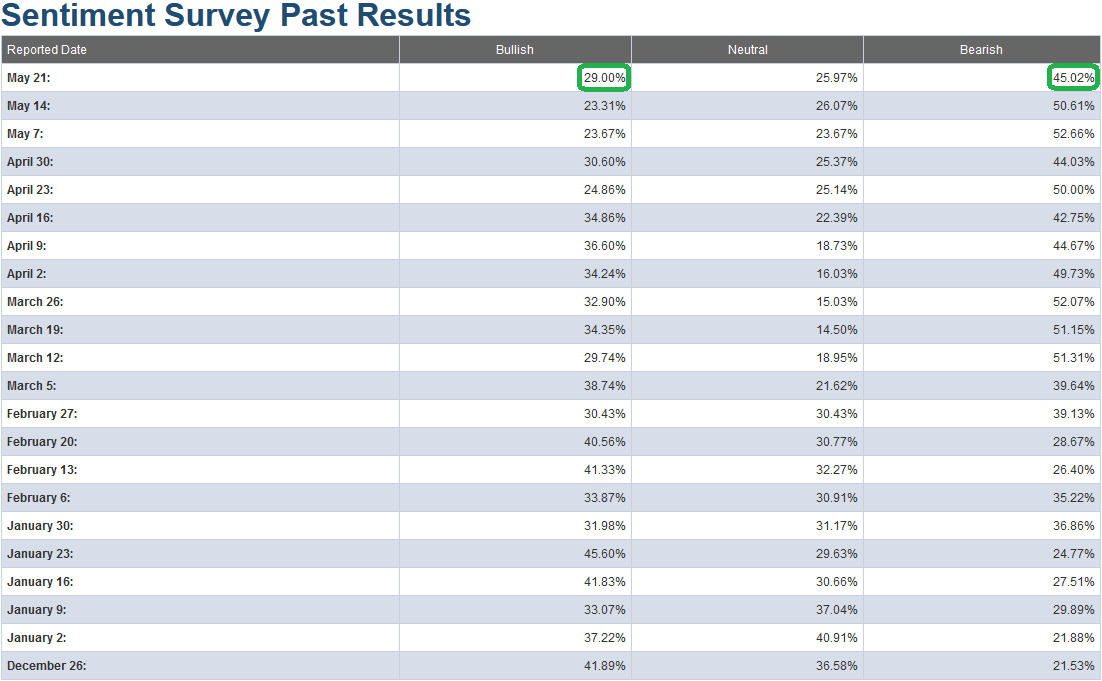
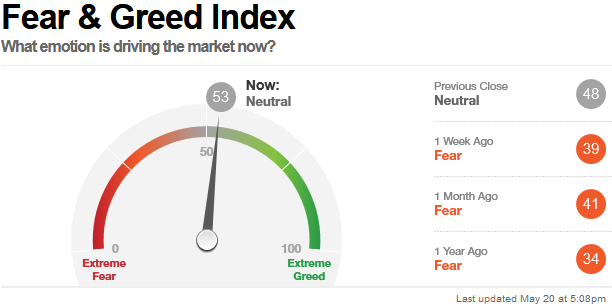
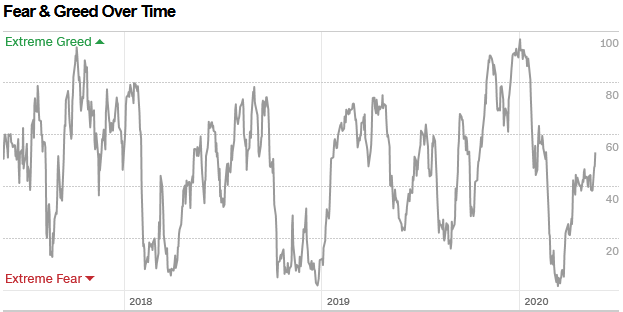
The CNN “Fear and Greed” Index jumped from 38 last week to 53 this week. The fear continues to thaw and will move in fits and starts in coming weeks. You can learn how this indicator is calculated and how it works here: (Video Explanation)
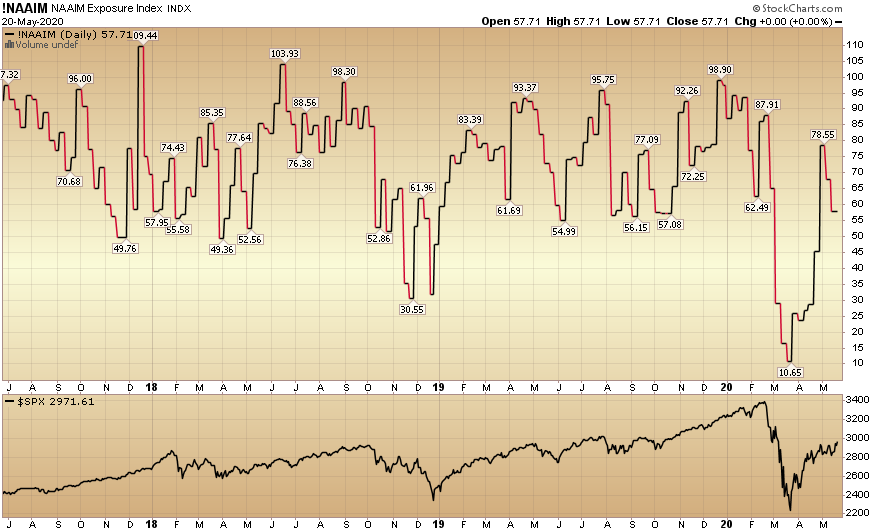
And finally, this week the NAAIM (National Association of Active Investment Managers Index) (Video Explanation) fell from 67.95% equity exposure last week, to 57.71% this week.
Our message for this week:
In case we forgot to mention it: We like Banks.
We also like and own pockets of Defense Stocks, Home Builders, Energy, and Small Caps. It will not be a straight line up, but over the next 6-18 months we believe we will see relative strength in these groups. This will happen as demand kicks in (people return to work) and the (what will be) >$10T of stimulus/aid/liquidity starts to circulate in the economy.
We may see growth levels by 1H 2021 that would not be possible if not for COVID-19 – as we would never have this level of global FISCAL (and monetary) policy at play…
So to answer Grace Potter’s initial question, “are we Falling or Flying?” I think the answer is – it depends on your sector selection moving forward as we continue to climb the “wall of worry.” On Grace’s Monday night live stream this week, she gave the best answer to that question that I can think of – in her song “Tiny Light:”
Like a flashbulb sparkle in the night
I see a tiny light
Telling everyone to hold on tight
But it’s not gonna shine without a fight…


