After the Fed induced debacle in December 2018 – which caused the S&P 500 to cascade down over 16% in 3 weeks (making it the worst December since the Great Depression) – they took the Grinch out behind the barn and finished him off! There will be no Grinch this year, and Santa Claus is coming to town…
All I Want for Christmas is…
1. A US Omicron Peak (like South Africa):
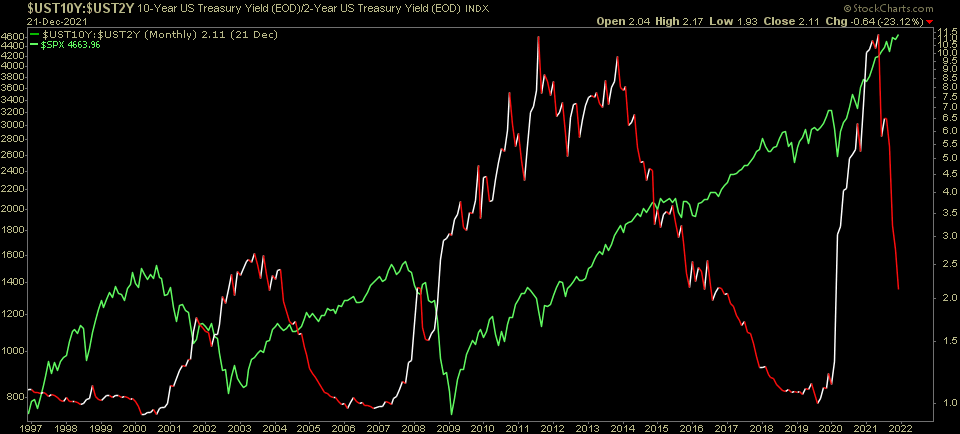
2. A Steeper Yield Curve:
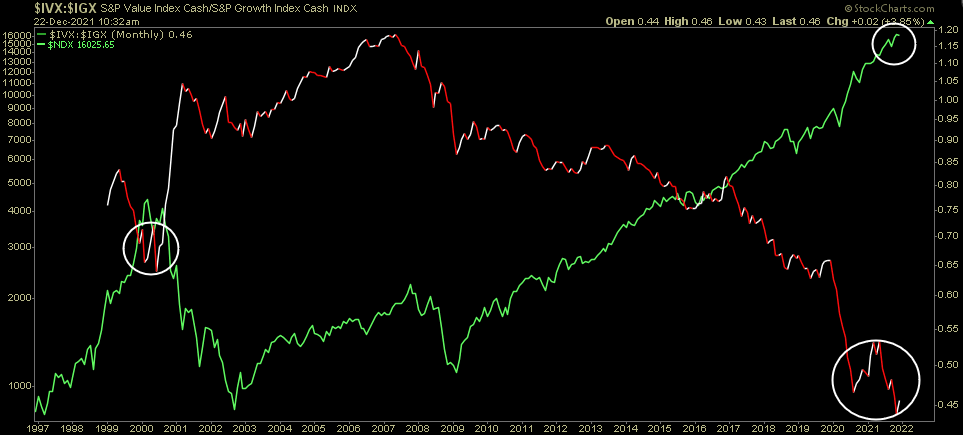
3. A stronger bid in Value:
4. China to awaken from its slumber (as it has in the 12 months preceding every National Party Congress Meeting – Nov ’22):

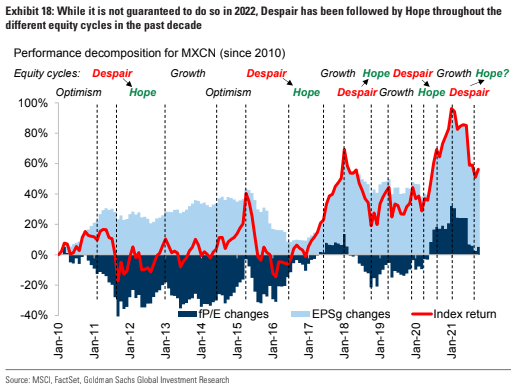
5. Even more equity to take advantage of the abundant opportunity ahead of us. When you get the “fat pitch” down the middle of the plate, you can never have enough personal/client capital to put to work and seize the opportunity. No matter how big you grow over the years, when that right opportunity comes, more is better! I believe the value in very selective High Quality Large Cap Chinese Tech right now is the fat pitch down the middle of the plate that can turn into a 2022 home run – if done in prudent size (more on this below). We are well prepared…
The Grinch is Dead!
On Tuesday I was on Fox Business – The Claman Countdown – with Liz Claman. Thanks to Liz and Ellie Terrett for having me on:
Watch in HD directly on Fox Business
Below are the Show Notes before the segment. We could not get to most of this because President Biden’s speech took the first 20 minutes of the show and they were short on time:
There will be NO Grinch this year! After the 16% Fed induced crash in December 2018, they took the Grinch back behind the barn and finished him off! Santa Claus is coming to town this year!
Omicron: The case count has rolled over in South Africa after hitting an all-time high. Rise started Nov. 24 and peaked just 2.5 weeks later on Dec 12 at 37,875. South African case count has now collapsed –77.53% in 8 days. Market is hopeful that this highly contagious ramp and drop will replicate in other markets. So far, highly contagious, but milder symptoms (for boosted).
Earnings: Despite omicron and the GDP downgrade by Goldman Sachs yesterday, earnings estimates continue to creep up for 2022 – now at $223.48 for the S&P 500 (up 9% for 2022). This is a tailwind for the market gaining high single digits to low double digits in 2022.
Headwinds: Second year of the Presidential Cycle tends to be the weakest of the four. Market will start to discount the removal of liquidity following taper and we should see a much bumpier ride in 2022 than we did in 2021. Average returns for the year (high single digits to low double digits), but expect 10%+ pullbacks along the way.
(source: LPL, Ryan Detrick)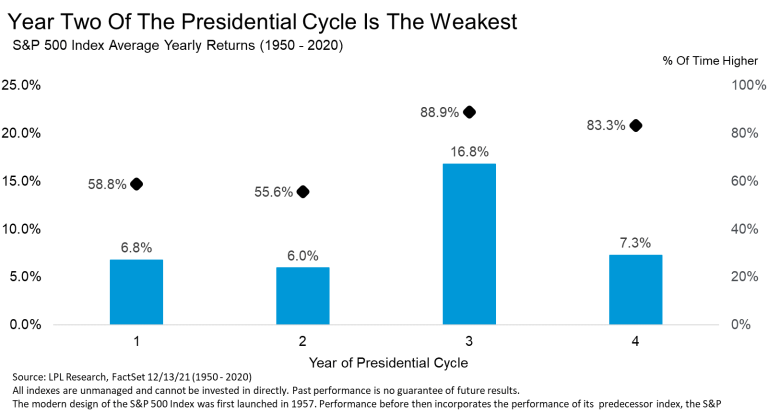
 Don’t Fear the Reaper! S&P 500 gains on average 7.7% in the 12 months following the first rate hike.
Source: Deutsche Bank via Anne Sraders at Fortune:
Analysts at Deutsche Bank identified 13 separate hiking cycles since 1955, which lasted an average of under two years. And according to their research, which examined the average price performance of the S&P 500 on a daily basis, “there tends to be solid growth in the first year of the hiking cycle, with an average return of +7.7% after 365 days,” the analysts at Deutsche Bank wrote in a Monday report.
However, “after the initial peak on day 253 after the tightening cycle, it’s not until day 452 that this level is exceeded again, and even on day 712 it’s still trading beneath its level on day 253,” they wrote (see Deutsche Bank’s chart below).

Original version Blue Oyster Cult:
“More Cowbell” version with Will Ferrell:
10yr yield rising favors value/cyclical/small caps: Big Opportunity in Industrial sector in 2022. Industrials earnings growth will be +36% relative to S&P 500 at +9%. This is not priced in. Opportunities in sub-sectors: Travel: LUV – Bet on recovery, pent up travel demand. TSA passthrough >80% 2019 this week (>2M/day). Defense: RTX 16.5x 2022 EPS (18x historic). 2.5% div yield. Supply chain & aerospace will recover in 2022. Industrial: GE – sum of parts greater than whole in breakup. Larry Culp one of best CEOs in the country.
You can see in the table below which sectors outperformed in the 12 months after the first rate hike. Small Caps, Energy and Value are at the top of the list. Value dramatically outperforms growth 12 months out:
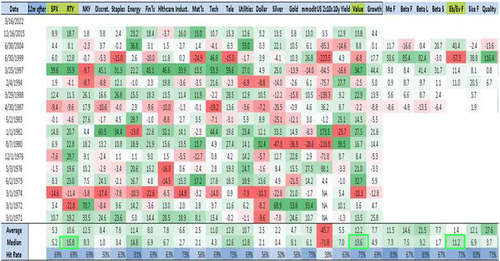
Source: Nomura via (ZeroHedge)
We have been comparing 2022 to 2014 and 2018 (higher volatility years after LOW volatility years 2013 and 2017). We are giving greater weight to 2014 because it was a taper year: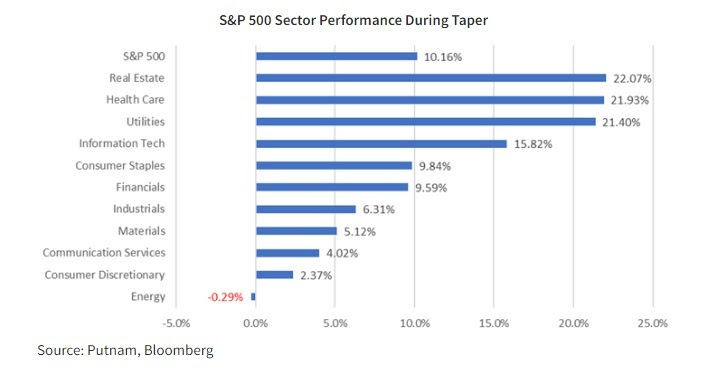
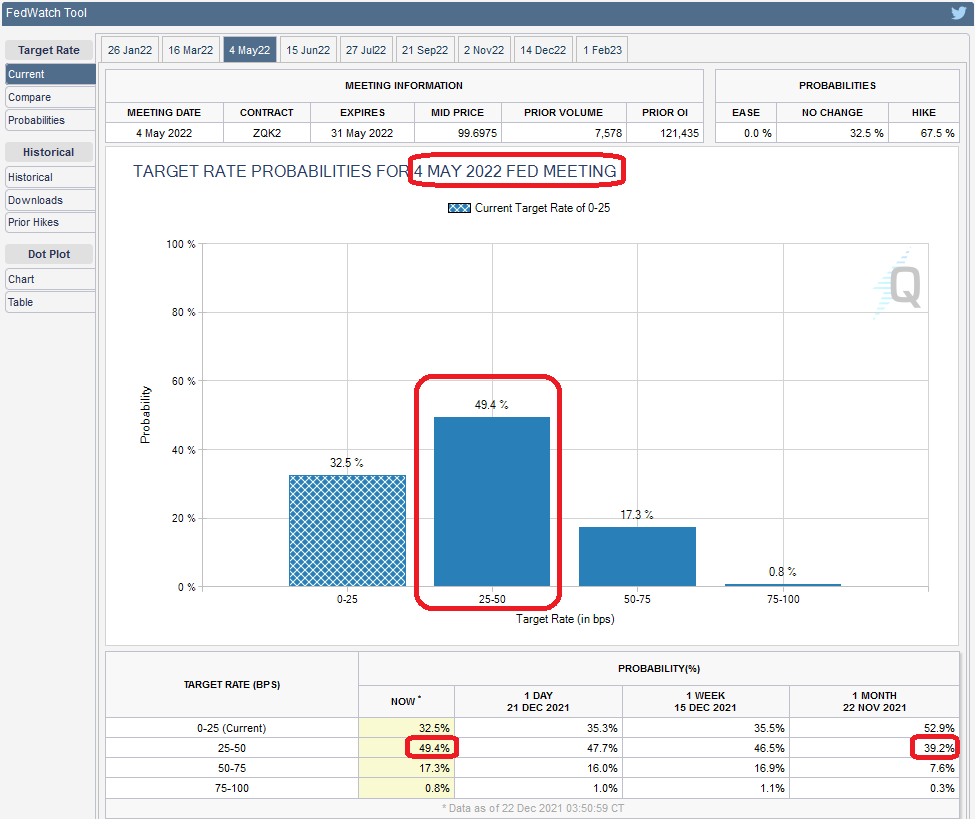
So while Small Caps, Energy and Value outperform in the 12 months following the first rate hike (which may come this spring), for Nov 2021- March 2022 (the taper period), we may see some continued legs in Health Care (see above). Here are the rate hike odds for the May 4, 2022 FOMC meeting. They continue to creep up (Source: CME):
Tailwinds for Santa…
While we’ve had a nice move in the past two sessions and may breathe for a session or two, here are a few indicators that suggest Santa has some gas in the tank for the final week of the year and into January:


China
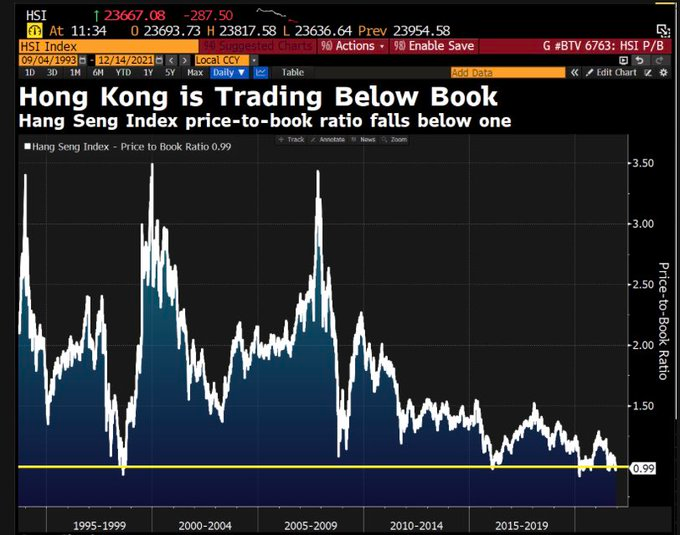
Last week we showed you what happened each time the Hang Sang Index traded below book value (as it is now). This week we have a few more charts to give you an idea of where we may be in the cycle:
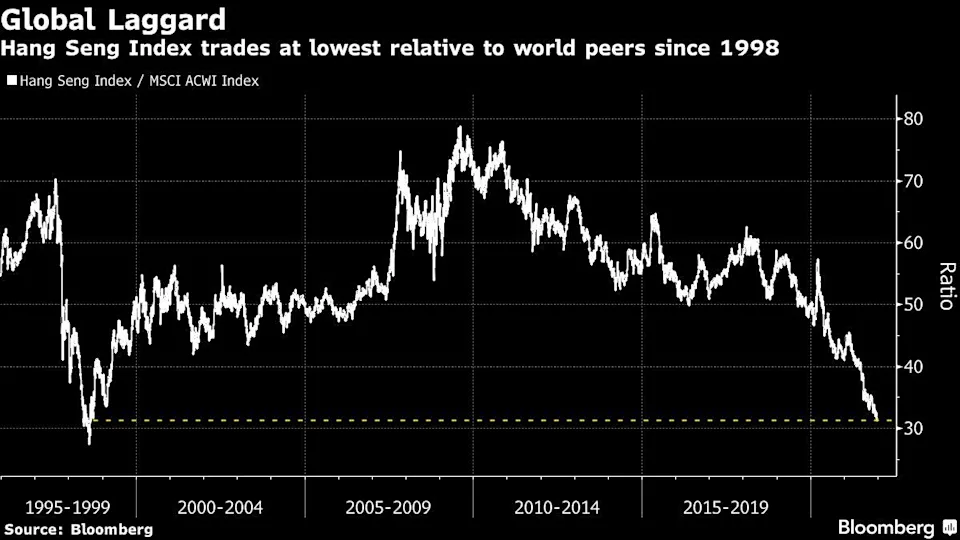
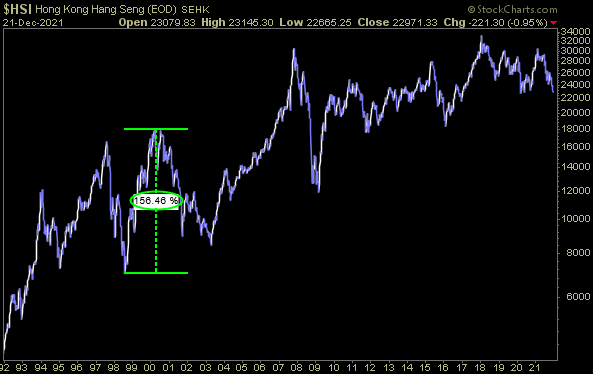
The last time the rubber band got stretched this far (Hang Seng relative to the world), it rebounded 156% over the next 17 months. This means many of the individual stocks in the index were up 200-250% or more over the same period.
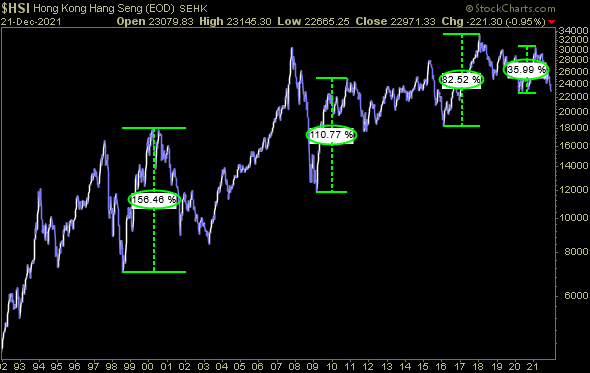
Here is the magnitude of the rallies in the Hang Seng Index from last week’s price/book chart:
1998: 156.46% in 17 months
2008: 110.77% in 21 months
2016: 82.52% in 23 months
2020: 35.99% in 11 months
As a point of reference, during the 2 periods that the Hang Seng reverted from depressed levels (while Alibaba was a public company), here’s what happened to Alibaba:
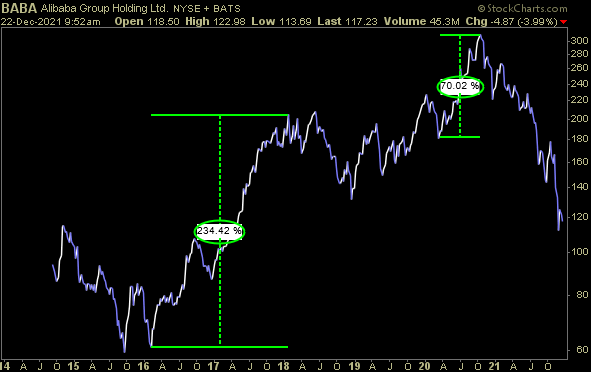
In both cases, Alibaba DOUBLED the returns of the Hang Seng.
Here’s another chart from this week that mimics the Goldman Sachs report we covered two weeks ago on our podcast|videocast, as well as the normal 3-5 year rhythm we’ve been emphasizing in the last month or so (regulatory crackdown -> economic slowdown -> stimulus/easing -> rinse/repeat):

Now onto the shorter term view for the General Market:
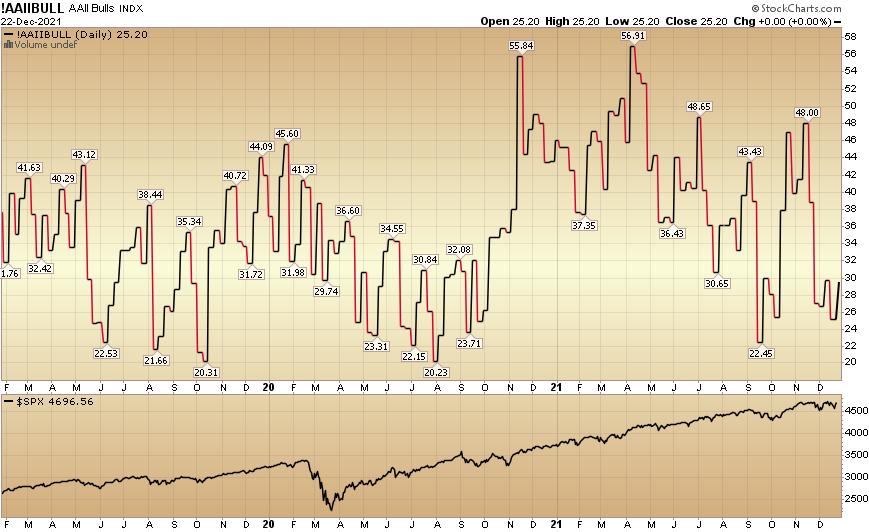
In this week’s AAII Sentiment Survey result, Bullish Percent (Video Explanation) ticked up to 29.6% this week from 25.2% last week. Retail optimism is slowly rebuilding.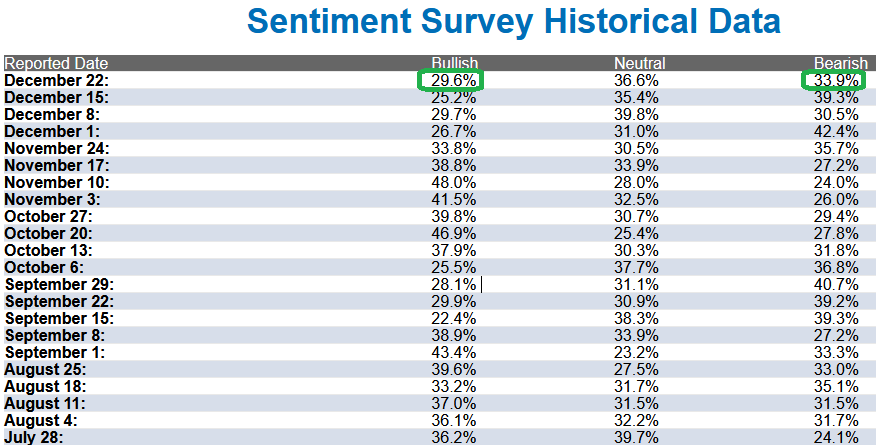
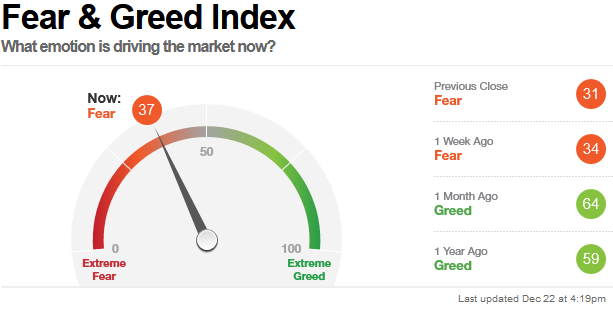
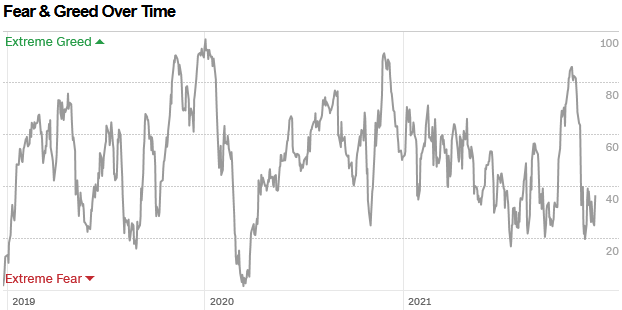
 The CNN “Fear and Greed” Index ticked up from 34 last week to 37 this week. Fear is still present. You can learn how this indicator is calculated and how it works here: (Video Explanation)
And finally, this week the NAAIM (National Association of Active Investment Managers Index) (Video Explanation) dropped to 52.22% this week from 69.46% equity exposure last week. Managers will now have to chase Santa next week.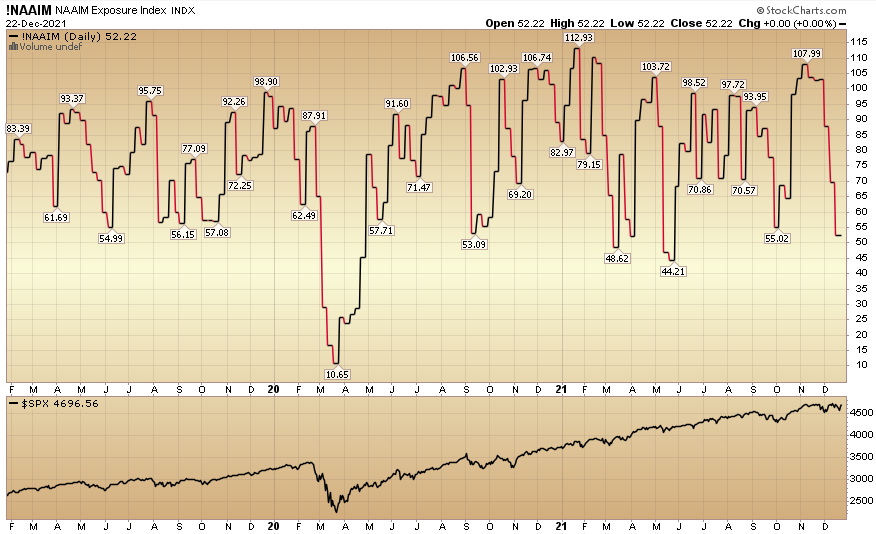
Our outlook for 2022 remains intact – high single digit to low double digit returns for the S&P 500 – with much more volatility as participants sniff out liquidity withdrawal by Q2. We will continue to be focused on buying those areas of high quality – that are on sale – and trading at reasonable valuations. We’ll go into more on this week’s podcast|videocast. See you then…
Happy Holidays!


