While it looks like we are finally close to the inflection we discussed last week, we must vigilantly recognize the salient lyrics in Country Star Mitchell Tenpenny’s new hit:
Guess close only counts in horseshoes and hand grenades
Horseshoes and hand grenades (Close but no cigar, close but no cigar, close but no cigar)
In last week’s note we laid out the case that due to extreme positioning, it was likely that the “risk in the market is to the UPSIDE, not the downside:”
We stand by that assertion. The February lows have held to date.

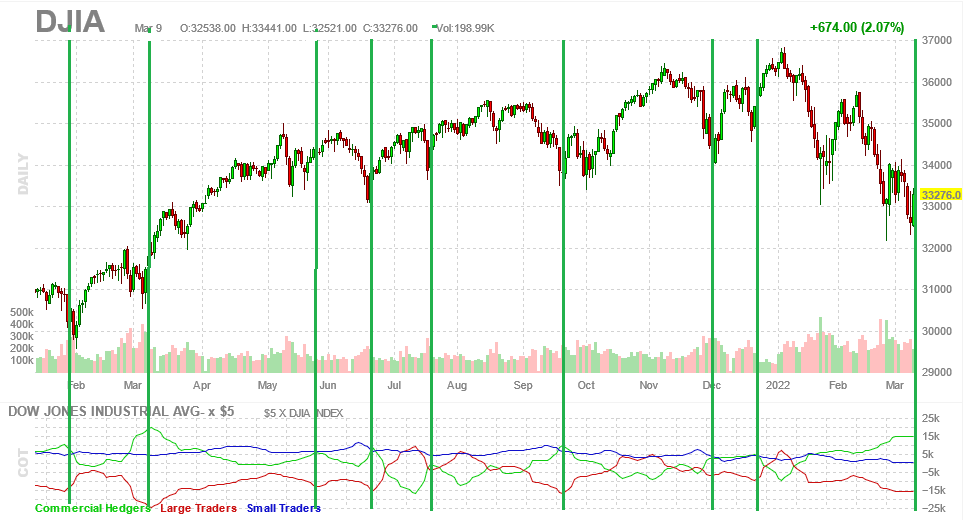
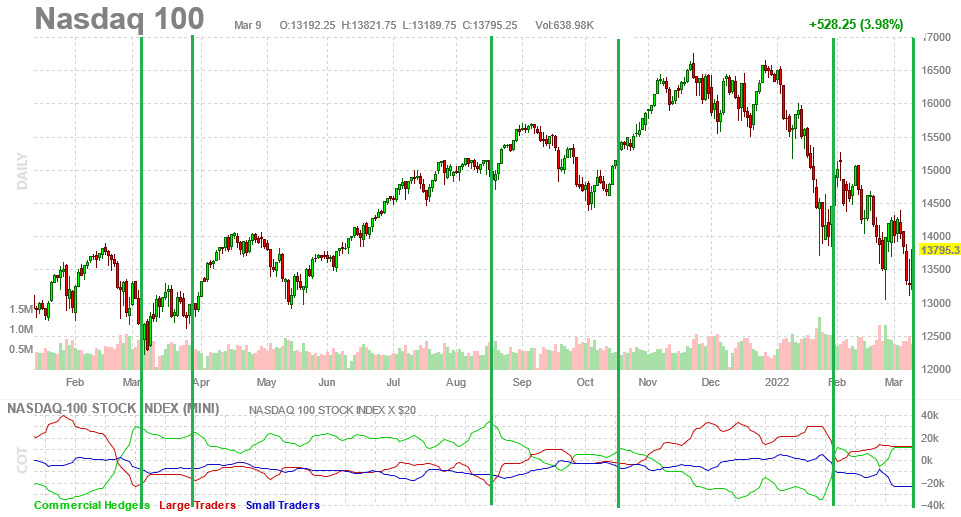
Two weeks ago we said to “Follow the Big Dogs” and laid out a case for bottoming based on how the “Commercials” were starting to position:
We stand by that assertion. Here are the updated COT charts:
The Money Show
This week I was fortunate to be chosen as a presenter on the MoneyShow: “MoneyShow has a long history (40 years) of creating successful investors and traders through timely investing and trading education, delivered by powerful experts who are best-selling authors, market analysts, portfolio managers, award-winning financial journalists, and newsletter editors.” Thanks to Charlotte Pessall, Debbie Osborne, Marc Sproul, and Aya Omar for having me on:
Watch directly on MoneyShow.com
In this presentation I covered the concept of “Benefitting from Extremes” and “Knowing what you Own.” I went through a handful of trades throughout my career, the thesis we had before they took off, and how we managed the short term if/when the position moved against us. I also laid out our two biggest ideas for right now and took a couple of questions regarding those positions. You can follow along with the slide deck here:
More on the Market…
For those who have followed me for some time, you’ll recognize we have a contrarian streak (to put it mildly). This week a new data point came out that caught my eye. It showed that Hedge Funds have been less reliable than retail investors as in indicator for forward returns. Another gentle way of saying – of late – Hedge Funds have been the “dumb money.”
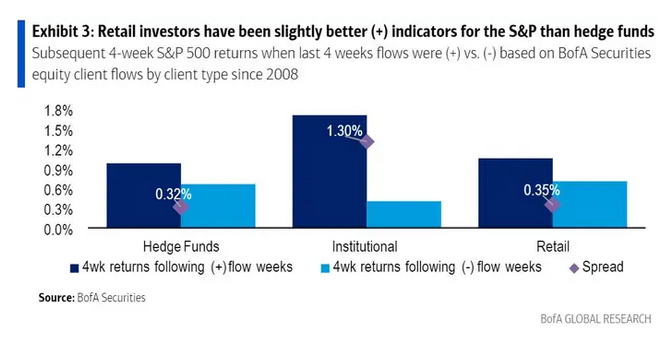
Yesterday, Bank of America showed that while Hedge Funds were degrossing at a record pace (friendly word for panic selling “in the hole”), retail investors were net buyers.

(Reuters): “Bank of America’s clients sold U.S. equities last week for only the third time this year, with sales being entirely led by hedge funds, who had a record week of outflows, Bank of America analysts Jill Carey Hall and Savita Subramanian said in a report. It came as markets were rattled by soaring energy and commodity costs after Russia’s invasion of Ukraine.
Retail clients, who have been net buyers every week this year, meanwhile, continued to buy the dip. Institutional clients were also buyers, and have been so in five of the last six weeks, Bank of America said.
***While retail investors are often maligned as being a contrary indicator for stock returns, Bank of America says this is not the case.
“S&P 500 returns following periods of retail inflows have been above-average and returns post-retail selling have been below average, with retail flows a slightly better positive indicator than hedge fund flows,” the analysts said.
Sector wise, retail investors have been focusing purchases in communications services, financials and industrials. Institutional clients, meanwhile, were the driver of outflows from information technology last week, while hedge funds concentrated their record outflows in the energy sector, Bank of America said.
“Despite the narrative we hear from some investors that retail is a contrary indicator, our data suggest the opposite,” BofA said.
“S&P 500 returns following period of retail inflows have been above-average and return post-retail selling have been below average, with retail flows a slightly better positive indicator than hedge fund flows,” the note explained.
In last week’s note we put out around a dozen indicators we look at which supported our view that odds favored being a buyer than a seller into weakness. Here are a few more that continue to support this sanguine point of view:
My most important Europe Models are turning UP from extreme levels – where Major bottoms formed throughout history.
Critically, today’s powerful rally matches the *initiation* phase of past Major advances.
Watch closely for basing and key leadership – in ALL Global Markets. pic.twitter.com/KbkZjytt4K
— Macro Charts (@MacroCharts) March 9, 2022
Midterm years see an average peak to trough correction of 17.1%.
12.4% so far this year feels uncomfortable, but need to remember this is normal in midterm years.
The good news is a year later stocks are up more than 30%. pic.twitter.com/4LhZhyaByJ
— Ryan Detrick, CMT (@RyanDetrick) March 8, 2022
It feels much worse, but the S&P 500’s 12.4% drawdown this year is right in line with the median intra-year drawdown since 1928 (-13%). $SPX pic.twitter.com/te2V9y3YCs
— Charlie Bilello (@charliebilello) March 8, 2022
“Once the Nasdaq initially falls 20%+ from a 52-week high, short-term performance has been relatively muted, but three, six, and twelve months later, median returns were better than average,” via @bespokeinvest pic.twitter.com/6oCEFEXBo4
— Jessica Menton (@JessicaMenton) March 8, 2022
What have you been buying of late?
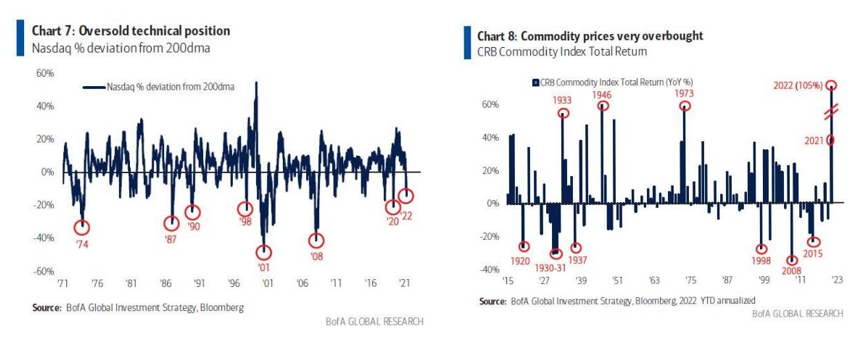
I’ve covered this in the last couple of podcast|videocast sessions, but these two tables encapsulate the message. The time to buy Energy was when we were pounding the table in 2020. Now that no one wants tech, opportunity is turning up on a selective basis (NOT high P/S stocks). Companies with demonstrable and growing earnings power and cash flow now re-rated and trading at low multiples are becoming very attractive at these levels. We covered two ideas in the MoneyShow presentation above.
Now onto the shorter term view for the General Market:
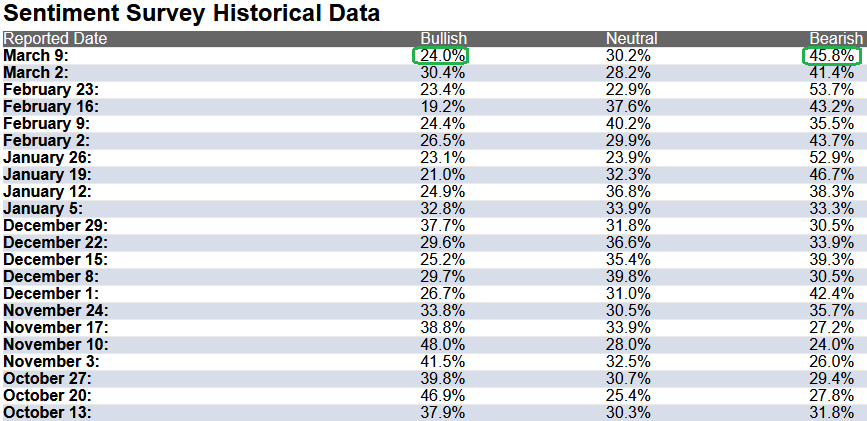
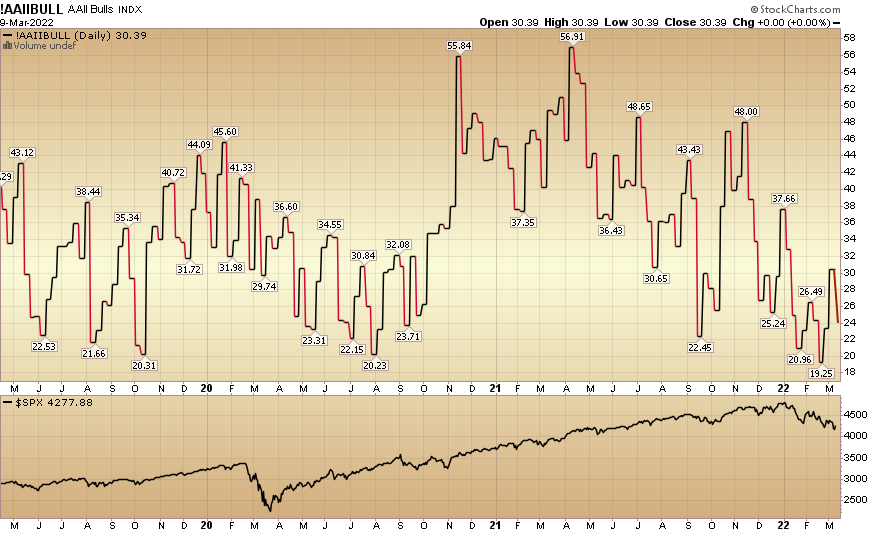
In this week’s AAII Sentiment Survey result, Bullish Percent (Video Explanation) fell to 24% this week from 30.4% last week. Bearish Percent rose to 45.8% from 41.4%. Retail trader/investor fear is back to 2020 pandemic low levels.
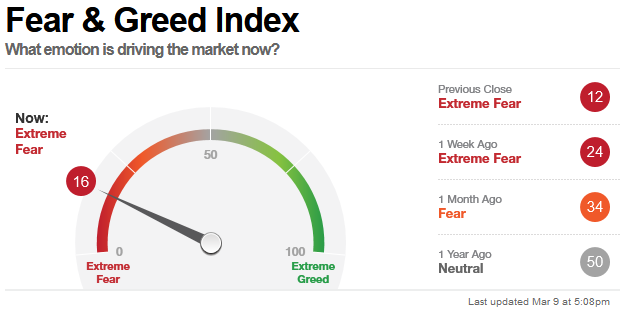
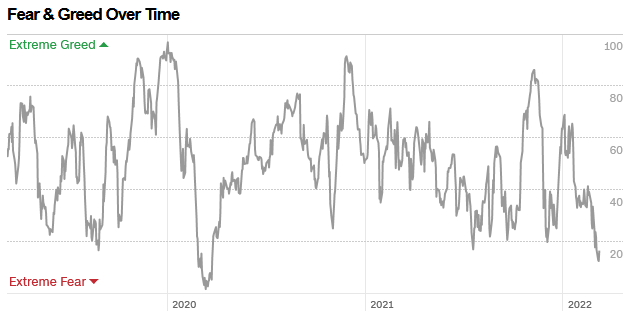
 The CNN “Fear and Greed” Index dropped from 24 last week to 16 this week. Fear is now at its highest level since the pandemic lows in 2020. You can learn how this indicator is calculated and how it works here: (Video Explanation)
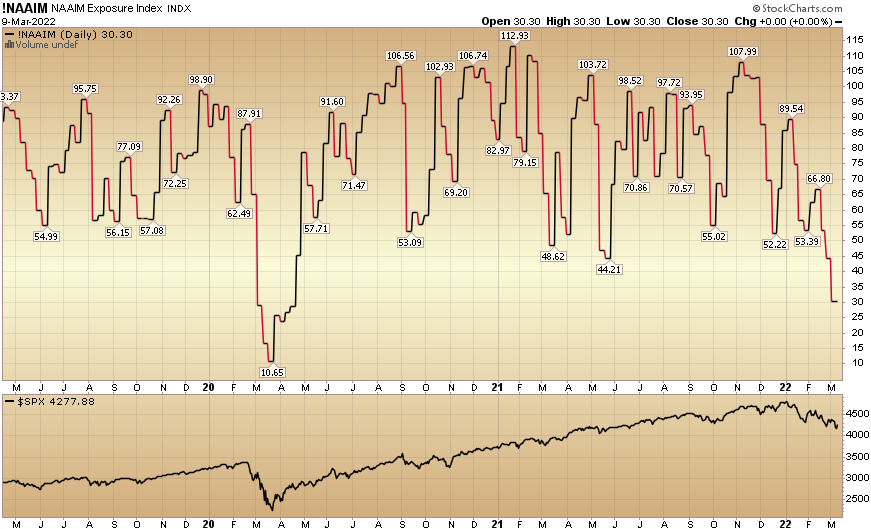
And finally, this week the NAAIM (National Association of Active Investment Managers Index) (Video Explanation) dropped to 30.30% this week from 44.41% equity exposure last week. Managers now have their lowest exposure to equities since the 2020 pandemic lows. Managers will have to chase any strength in coming weeks.
Our podcast podcast|videocast will be out tonight or tomorrow. Each week, we have a segment called “Ask Me Anything (AMA)” where we answer questions sent in by our audience. If you have a question for this week’s episode, please send it in at the contact form here.


