At the beginning of the year, we laid out the case for a 2013/2017 type market that would have a handful of small pullbacks (3-5%) on the S&P 500 – and likely finish out the year with a mid-teens gain. So far that has held true, and the short term panic may very well prove to be unnecessary.
Put another way, this week we chose The Weeknd & Ariana Grande’s Billboard hit, “Save Your Tears” to explain the current Market scenario and sentiment:
Save your tears for another
Save your tears for another day
Save your tears for another day…
So when is “another day” when we will finally get a 10-20% correction? My bet is 1H 2022, but for now, let’s focus on the task at hand as anything can happen between now and then.
On Tuesday I was on Fox Business with Liz Claman on the Claman Countdown. Thanks to Liz and Ellie Terrett for having me on.
In this segment, we discussed the 13F filings of large managers, and who we thought made the best trades for Q1.
While Liz was focused on Buffett, Wood, and Burry, we pivoted to George Soros’ family office. Why? Because we found out in his filings this week that he had the EXACT SAME TRADE as we posted last week in our “The “Archegos’ Loss is Your Gain,” Stock Market (and Sentiment Results)…” Watch the segment to learn why I think Soros’ and Our (China) trade may prove to be the “trade of the year”:
We have consistently stated that we are in a period of “crosswinds” and to pay less attention to the general indices and more attention to looking for the “rallies under the surface.” Last week we put out 10 indicators that laid out the groundwork for an imminent bounce in the Nasdaq. We got it to the day:

We also got a nice retest this week – and we’ll see how it holds up. A number of the FAANG stocks look healthy, but I’m not convinced that the weakness is done for AAPL (even Cathie Wood dumped her position). They have material overhang with the 30% app store extraction (fee) now under scrutiny in both US and EU lawsuits. That “toll fee” is the crux of their services growth story and if it becomes impaired, it will have a meaningful deleterious impact on the stock.
The opportunity in the Tech space – as we have covered in recent podcasts/videocasts is in selective SAAS (software as a service) names that have been cut in half due to overblown inflation fears. Don’t get me wrong – inflation is here, it will not be transitory, BUT it will not be out of control either. It will be moderate, likely orderly (after the initial base effects from last year work through) – and ultimately a healthy sign of growth that will be moderated with steady Fed intervention down the road.
@MacroCharts put out a chart (from Mark Hulbert) this morning that pointed to the extreme pessimism in the sector.
Everyone has a foot out the door:
• Nasdaq Newsletter Exposure has plunged at one of the fastest rates in history.
• “That reflects a remarkably quick rush for the exits”
• Previous cases led to the Nasdaq gaining +5.3% over the next month on average – watch closely. pic.twitter.com/KZpkgpC8PB— Macro Charts (@MacroCharts) May 19, 2021
Tech exposure plunged from +83.6% net long to -10.7% net short in just 10 days. That is extreme and lines up with the 10 indicators we put out last week. The last few times a move of this magnitude occurred (with this indicator) the Nasdaq was up on average +5.3% a month later.
This week, Bank of America published its monthly Global Fund Managers survey. The findings (as it relates to Tech) were similar to my note last week and the chart above:
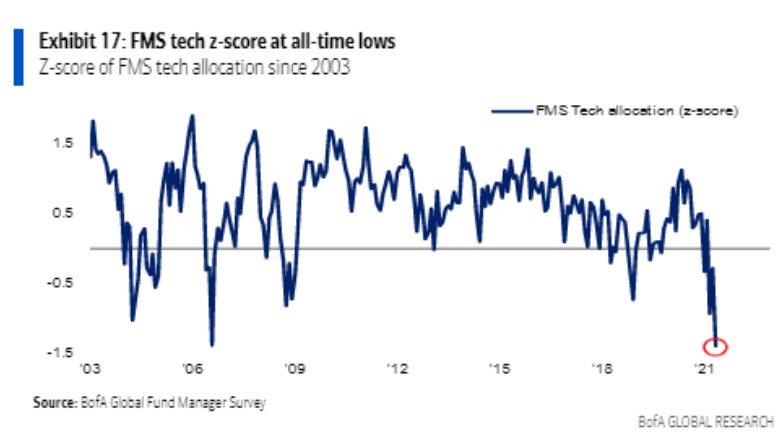
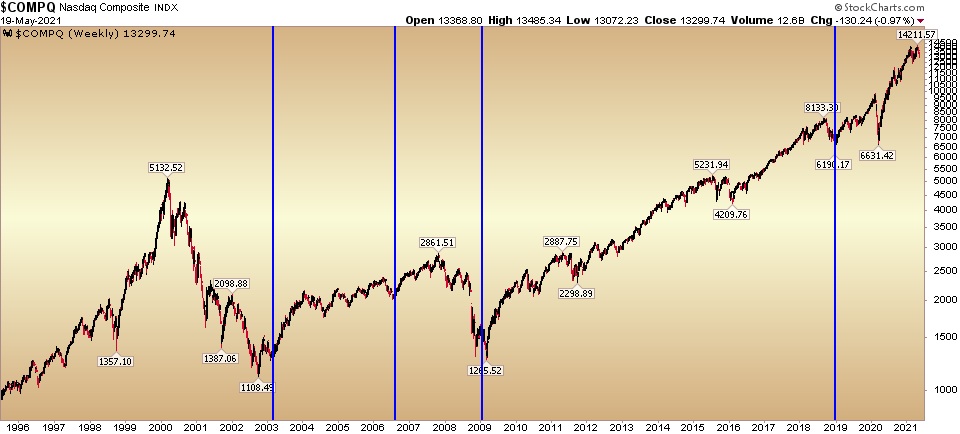
As you can see, the last 4 times when the Z-Score of Fund Managers surveyed dropped below -0.5 (2018, 2008, 2006, 2003), were near bottoms in the sector. That said, I continue to repeat I am not making a wholesale call on Tech, but there are bargains at these levels that are simply too good to pass up – in our view. We have covered a number of them in recent media spots/videocasts/podcasts.
When I talk about crosswinds, it is hard to get “pound the table” bullish on the general indices after a ~90% move off last year’s lows and this level of sentiment in the BofA Survey:
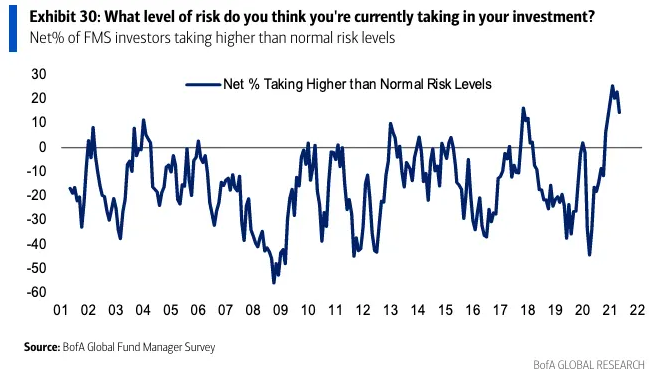
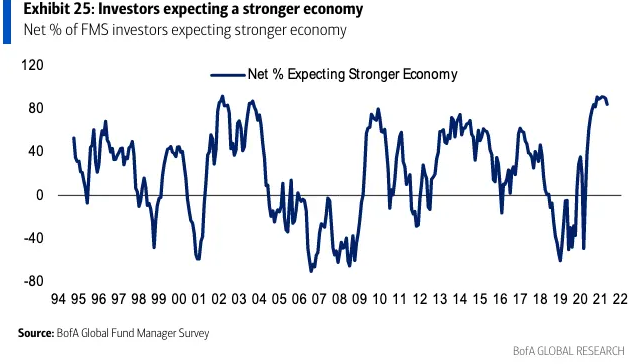
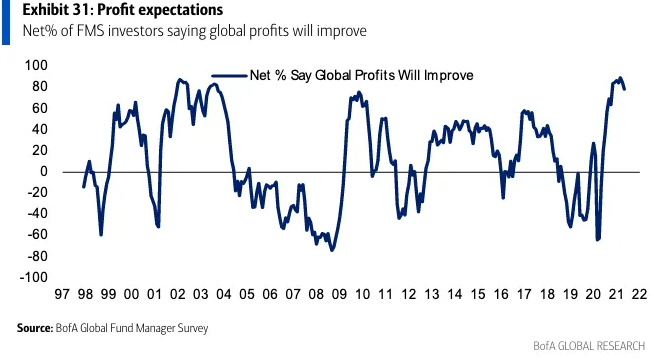
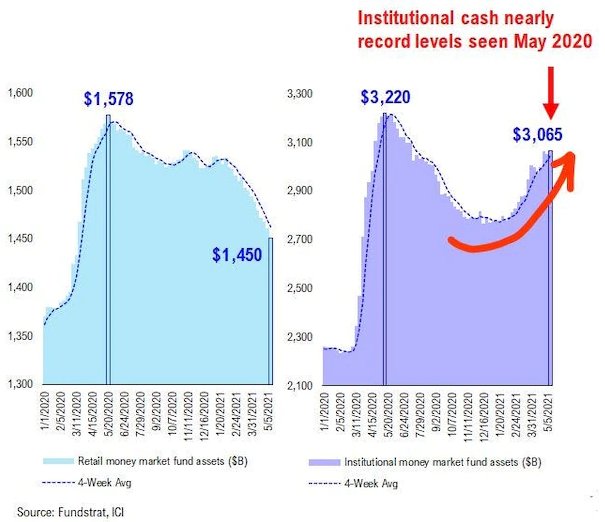
However, if you look carefully at the 3 charts above, while sentiment is very high, that is also consistent with the first leg up in new bull markets. It swings from despondency and complete pessimism to euphoria overnight. We saw it both in 2003 and in 2009. It cooled off in 2010 once we got the first 10-20% correction. The same will likely happen in the next year – once everyone’s back in the pool and a good portion of $3.065T comes out of Institutional Money Markets (hasn’t been this high since May of last year).
Source: Tom Lee – Fundstrat via Business Insider
Now onto the shorter term view for the General Market:
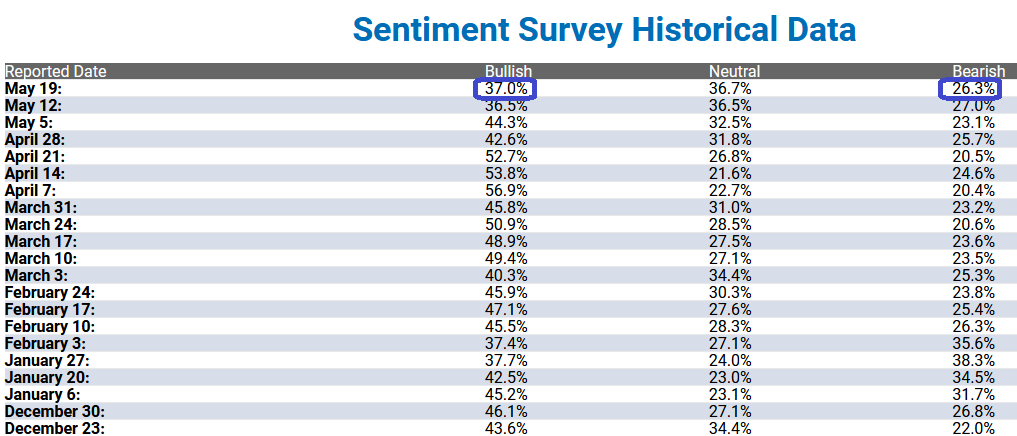
In this week’s AAII Sentiment Survey result, Bullish Percent (Video Explanation) inched up to 37% from 36.5% last week. Bearish Percent ticked down modestly to 26.3% from 27% last week.

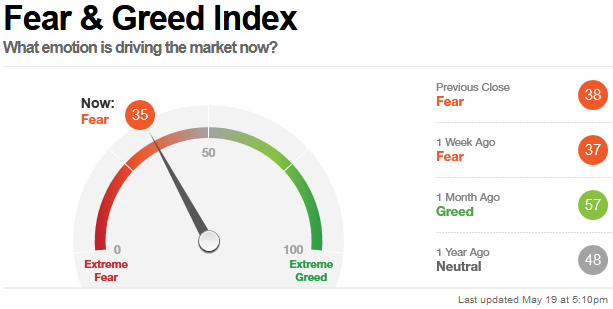
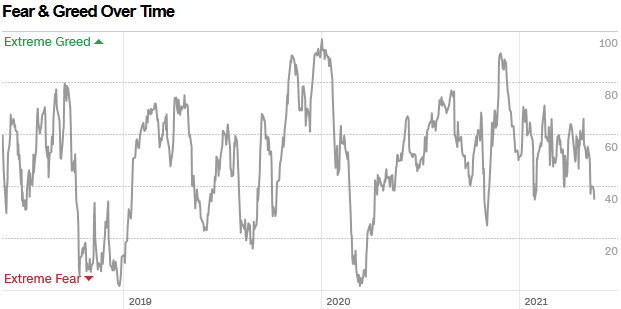
The CNN “Fear and Greed” Index ticked down from 37 last week to 35 this week. Fear is here. You can learn how this indicator is calculated and how it works here: (Video Explanation)
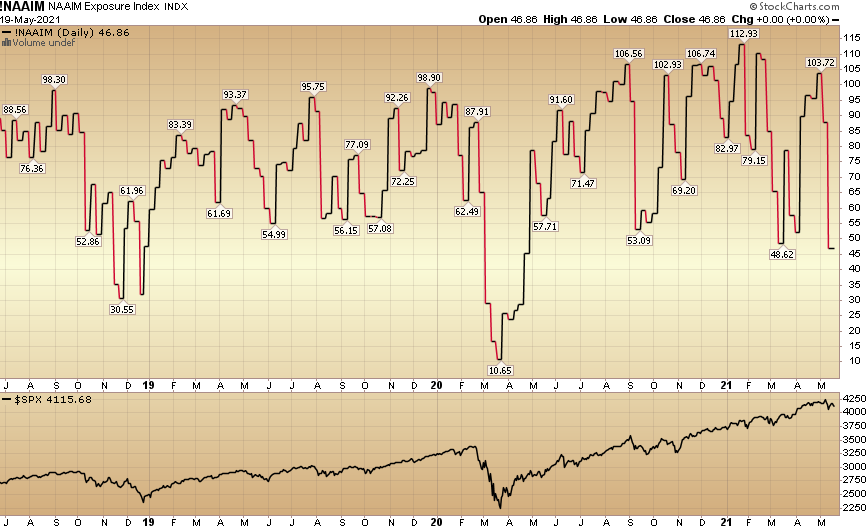
And finally, this week the NAAIM (National Association of Active Investment Managers Index) (Video Explanation) dropped to 46.86% this week from 87.79% equity exposure last week. A bounce at these levels will force these underweight managers to chase very quickly.
Our message for this week:
We continue to pick our spots and look for the “rallies under the surface.” We have spent the last couple of weeks building China positions, selected SAAS/Tech positions, and SPAC warrants (mostly selective “busted” SPACs with announced deals that have rolled over – but have interesting businesses/sponsors for the long-term). You can explore a list of completed SPACs here.
I’m in the minority that I think last week’s jobs report gave the Fed cover to push tapering from consensus Q4 2021 to Q1 2022. That’s when I think we’ll get our first larger correction of this new bull market (lower probability beforehand). In the mean time, we buy where we see dislocation and don’t expect much from the general indices. We believe the “big money” will be made “under the surface” for the rest of the year.
For now you can, “save your tears for another day…”


