On Wednesday afternoon the Federal Reserve issued their FOMC statement and plans for reducing the size of the balance sheet. I have underlined the key points here:
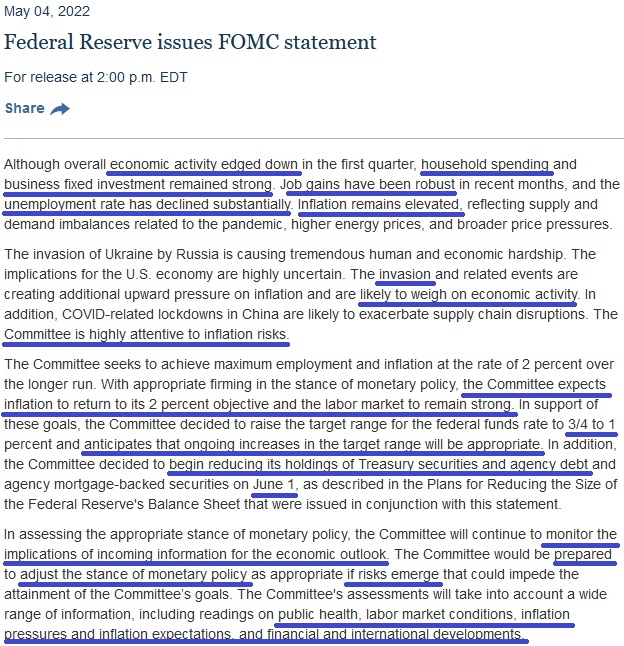
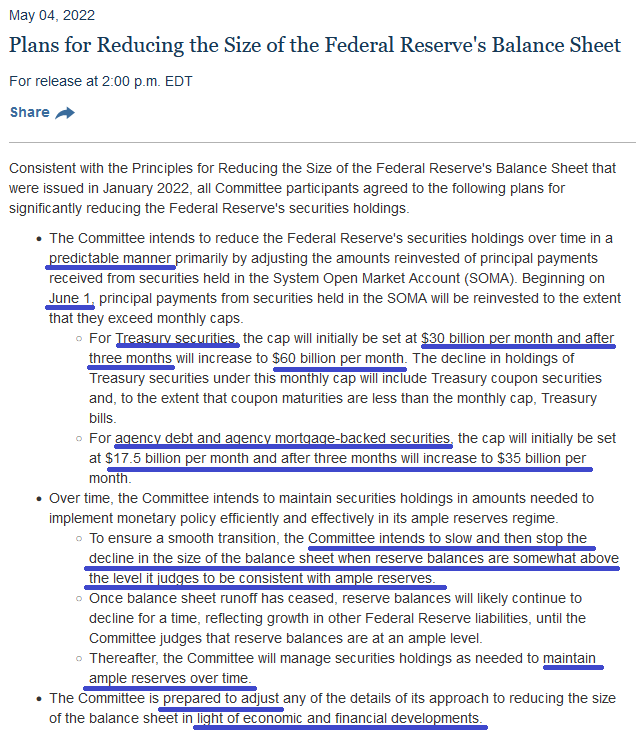
In the Press Conference Chair Powell made the following points that set the market afire:
- A 75bps hike is not something the committee is actively considering.
- 50bps hikes on the table for the next couple of meetings.
- Expects a soft/softish landing.
- Households and businesses are still in good shape.
- There is still excess savings.
- Labor market still strong.
- Expects that inflation has peaked or is at least flattening out.
- Core CPE may have peaked.
And with that, we were off to the races:

And while the S&P 500 is now up ~5.5% off the lows, there is still a lot of wood to chop to make it back to new highs (as I have been a lone voice calling for in recent podcast|videocast(s)).
Fox Business
Late last week I was on Fox Business – The Claman Countdown – with Cheryl Casone. Thanks to Ellie Terrett, Liz Claman and Cheryl Casone for having me on. In this segment, I laid out the case to separate emotions from the data. Sentiment was completely washed out, but the data did not justify all of the gloom and doom (particularly earnings data). I closed with a handful of “out of favor” picks that are now catching a nice bid:
Here were my show notes ahead of the segment:
Q1 Negative GDP print not as bad as it seems
–Fear: 2 consecutive quarters of negative GDP growth (technical definition of recession)
–Reality:
- 1st print, may be revised upward.
- Most of the decline was tied to 1) a record U.S. trade deficit 2) shrinking inventories 3) reduced government spending. (these 3 subtracted 5% from GDP).
Positives:
- Consumer spending rose at a healthy 7% pace after inflation — the highest in three quarters.
- Business investment jumped 3%. That was the biggest increase in a year.
Better Measure:
- Look at final sales to U.S. customers. This measure strips out exports and inventories and focuses on how much Americans are buying from U.S. and foreign sellers. At over 2.6% this was UP from 2H 2021.
Earnings tell the whole story:
The Generals held up (MSFT, GOOGL, FB)
-Earnings Estimates still going UP S&P 500: Up from $225 to $230.09 for 2022 in last 2 months.
-For CY 2022, analysts are projecting earnings growth of 10.9% and revenue growth of 9.5%. S&P was over 4800 in 2021. Imp: 5100-5200 high.
-For Q1 2022 (with 20% of S&P 500 companies reporting actual results), 79% of S&P 500 companies have reported a positive EPS surprise and 69% of S&P 500 companies have reported a positive revenue surprise. For Q1 2022, the blended earnings growth rate for the S&P 500 is 6.6%.
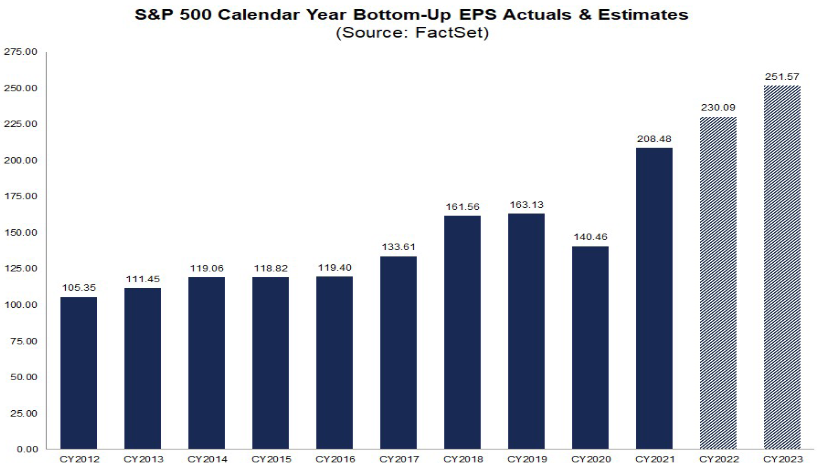
The forward 12-month P/E ratio for the S&P 500 is 18.1. This P/E ratio is below the 5-year average (18.6)
– CITI Economic Surprise Index ~70 in its most recent read. Highest Levels in over a year.
–US Factory Activity Growth Highest in 7 Months: Manufacturing PMI 59.7
-Unemployment rate still at 3.6%.
Sentiment WASHED OUT:
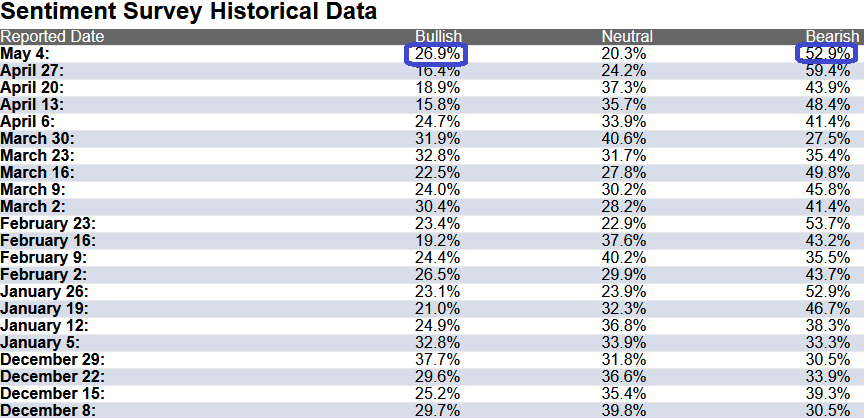
2 weeks ago AAII sentiment survey dropped to a 30 year low at 15.8% bullish. Last week it ticked up modestly to 16.4%.
When sentiment gets this low, over the last 25 years, 30 out of 31 times the S&P 500 is up 6 and 12 months later.
6mo later avg = +12.6% 12mo later avg = +19.8%
What to Buy (if time)?
Time to ease back into value tech (low multiple, cash generative companies that have sold off). Managers puked out of tech and into commodities in Q1. This will reverse as yields begin to stabilize. FB, INTC, TSM, GOOGL
Common Misconceptions
We’ve laid out the case for our two largest positions – Alibaba and Biotech – in recent podcasts. Key components of the bear thesis are that:
- Tech/Biotech will not work in a tightening cycle/rising rate environment.
- Emerging Markets (China) can’t work when rates are rising and the dollar is strong.
I always aim to burden myself with the facts, and in these cases the facts simply don’t support the exodus. The last tightening cycle (from 2016-2018+) was one of the BEST performing periods for BOTH Biotech (XBI) and Alibaba. The under-performance of both assets came leading UP TO the tightening. A classic case of “sell the rumor, buy the news.”
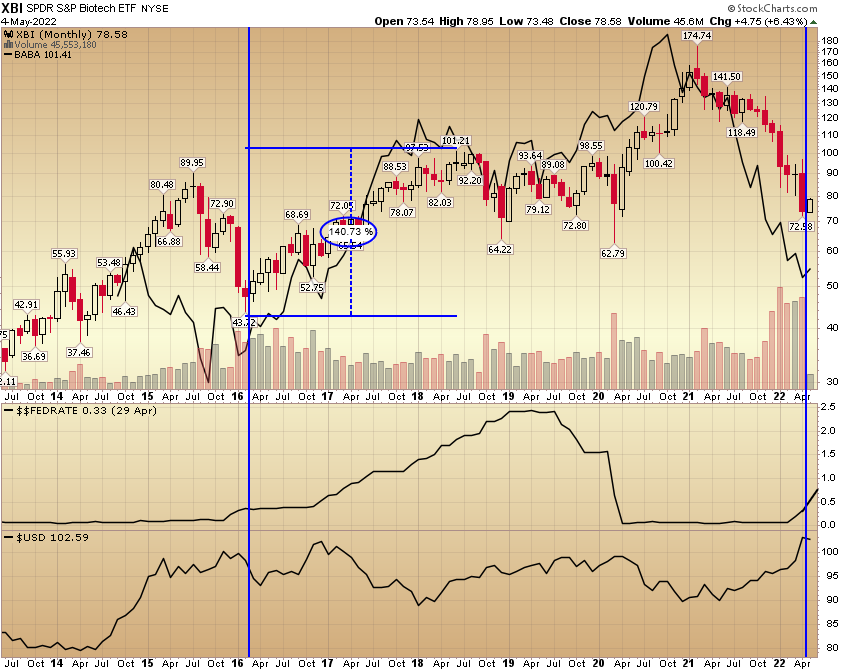
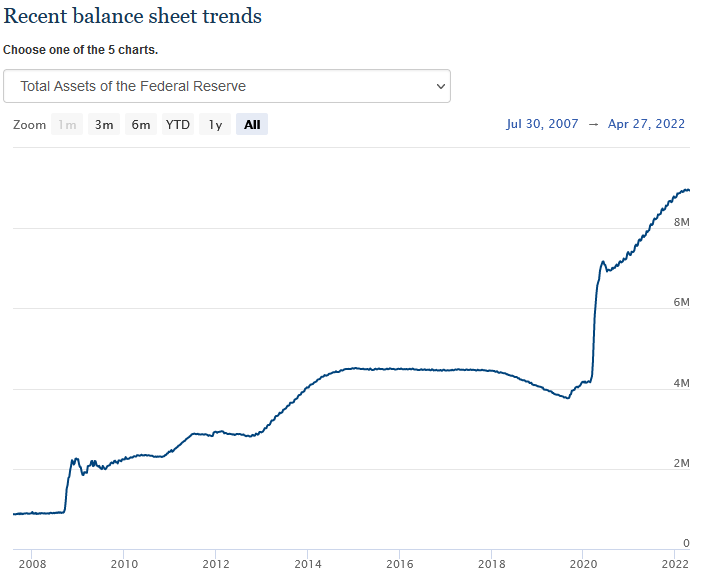

During the last Fed hike/balance sheet roll-off period (2016-2019 period), not only did Biotech (XBI) appreciate ~140% (trough to peak), but Alibaba appreciated ~263% (trough to peak) over the same tightening cycle.
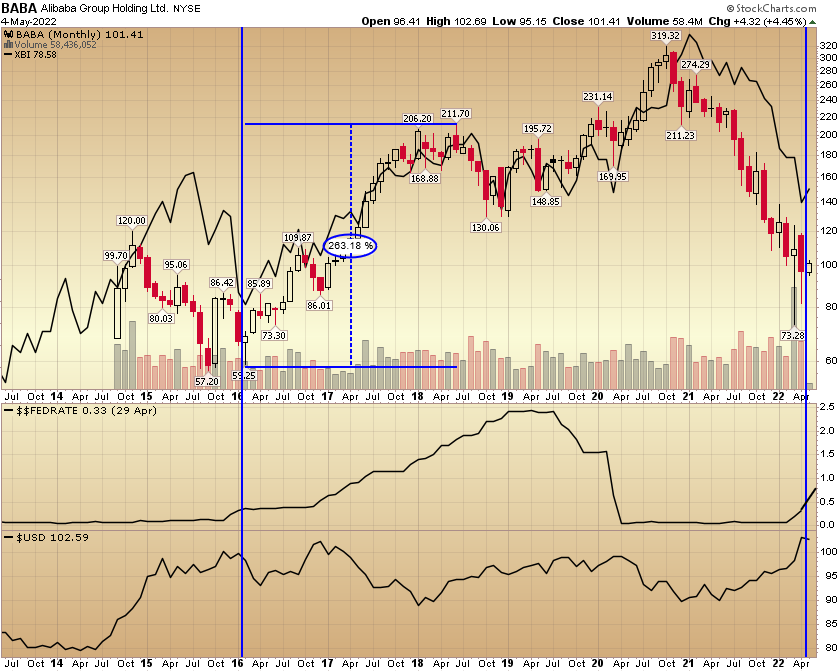
The two black lines on the bottom of the charts are the Fed Funds Rate and the US Dollar. We can see – by the vertical blue lines – exactly where we are in the tightening process and what happened next…
I also want to point out another key factor that China bears are pointing to at present:
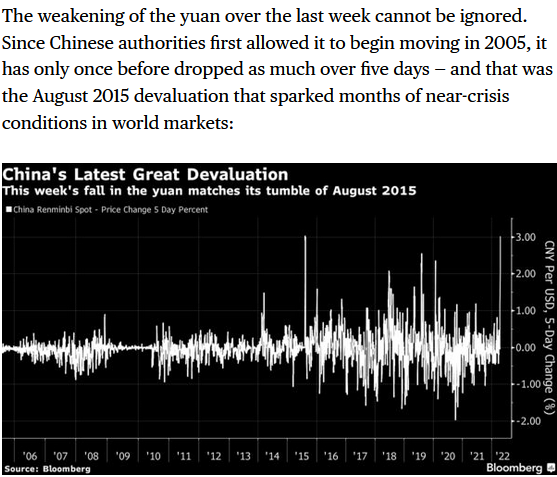 This Bloomberg note points out that the last time the yuan weakened this much in 5 days was August 2015 and it “sparked months of ‘near crisis conditions’ in world markets.”
What is not highlighted in this piece is that the yuan devaluation sparked one of the biggest multi-year rallies in the history of China Tech – with Alibaba rallying ~270% from August 2015 – July 2018. If that is “near crisis conditions” SIGN ME UP!
Here’s a clip from last week’s videocast regarding China Tech:
An important reminder for value investors 👇
Check out the full VideoCast: https://t.co/cyUr2wlyWZ pic.twitter.com/p1SJr4VIJH
— Thomas J. Hayes (@HedgeFundTips) May 3, 2022
The good news is that stimulus has been pouring into the Chinese economy since November. While the rest of the world is tightening, China is the only large economy aggressively stimulating with fiscal policy and loosening monetary policy. The bad news is it will not be felt in the economy until the lockdowns end.
There is a light at the end of this tunnel as cases are now rolling over just like they did during the first wave over two years ago:

Now onto the shorter term view for the General Market:
In this week’s AAII Sentiment Survey result, Bullish Percent (Video Explanation) jumped to 26.9% this week from 16.4% last week. Bearish Percent declined to 52.9% from 59.4%. Retail sentiment is thawing, but investors are still fearful.
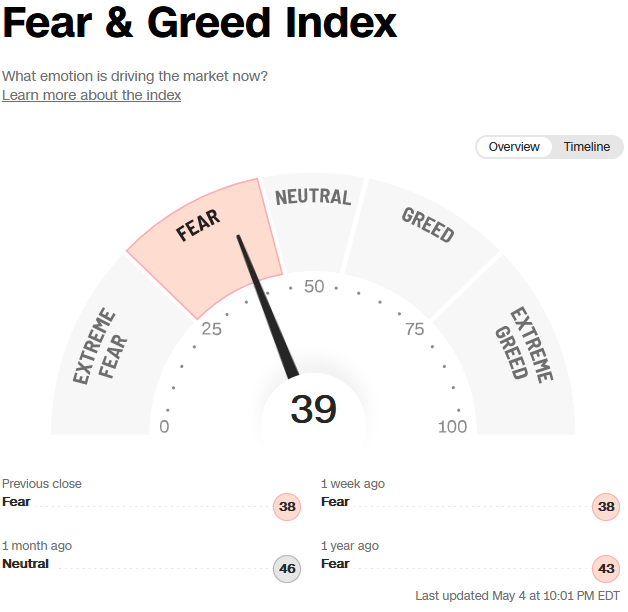
 The CNN “Fear and Greed” Index flat-lined from 39 last week to 39 this week. Sentiment is still fearful in the market. You can learn how this indicator is calculated and how it works here: (Video Explanation)
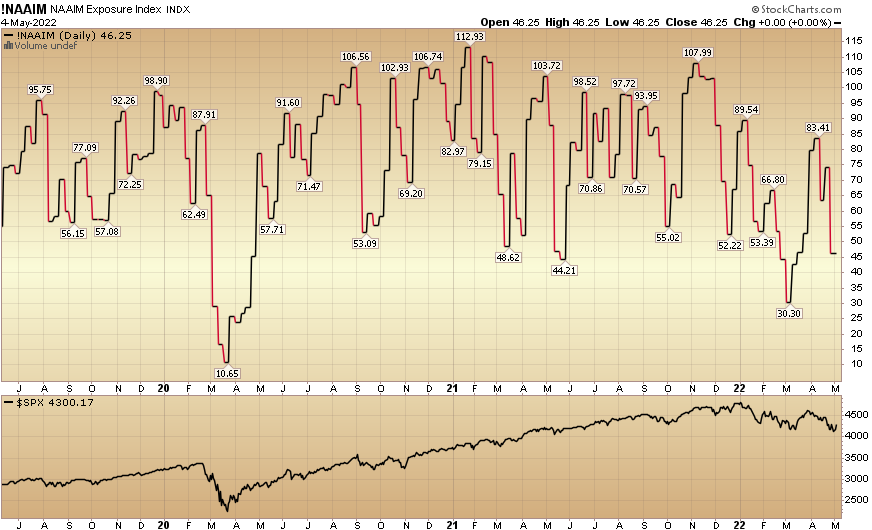
And finally, the NAAIM (National Association of Active Investment Managers Index) (Video Explanation) collapsed to 46.25% this week from 74.05% equity exposure last week. Managers got caught flat-footed yesterday and will have to “panic buy” strength in coming weeks.
Our podcast|videocast will be out on Thursday or Friday this week. Each week, we have a segment called “Ask Me Anything (AMA)” where we answer questions sent in by our audience. If you have a question for this week’s episode, please send it in at the contact form here.

