This week we’re going to have a little fun with our note. Many people know TikTok solely as the ByteDance owned social network app that President Trump attempted to ban.
TikTok is actually in its nascent stages of becoming the next Facebook (in terms of size and scope). Over 1.5B people have downloaded the app and there are ~800M MAUs (monthly active users). Like all social networks, it starts with young silliness and eventually becomes a mainstream platform that small businesses and large corporations vie to deploy billions of dollars of advertising dollars with.
TikTok is special in that it identifies and creates mainstream trends before any other form of media. The latest trend is the Billie Jean “Ghost” dance where the user activates a feature to “still” themselves while their “ghost” dances in the background (and then the ghost reconnects with the original still image).
The song that facilitates this trend is a remix of Michael Jackson’s “Billie Jean” so it hits the young and older audiences alike. I’m old enough to remember when the original version of “Billie Jean” was released in 1983 (I was 5!). It was a hit then and it’s a hit now that the young folks have gotten a hold of it:
“Okay Tom, what the hell does this have to do with the stock market? Get to the point!”
The concept of “ghosting” is now a popular culture concept. According to the “Urban Dictionary”, ghosting is when a person cuts off all communication with their friends or the person they’re dating, with zero warning or notice before hand. You’ll mostly see them avoiding friend’s phone calls, social media, and avoiding them in public. It’s also been referenced with young interviewers or interviewees “disappearing” after the interview.
As it relates to the stock market, while I’ve been bullish nearly every week since we put out our “bottom” article in March (MarketWatch), I think we’re now approaching a period when the Stock Market bull move is going to “Ghost” us in coming weeks. Like the dance video compilation above, I can see a situation where it (the stock market) “stills” then “ghosts” (which will mean a healthy correction or sideways choppiness for a number of weeks) then finally “returns” back to its previous level and resumes the dance (uptrend).
On Tuesday afternoon I was on Fox Business (The Claman Countdown) with Liz Claman. Thanks to Liz and Ed Krajewski for having me on.
In this segment, Liz asked me about the mad rush into EV (electric vehicle) stocks and how to play this move. The answer WILL surprise you (it’s not what you think):
On Tuesday evening I was on CGTN Global Business (CGTN America) with Roee Ruttenberg. Thanks to Roee and Stephanie Savage for having me on.
In this segment, we discussed China’s recent inflation numbers (CPI and PPI) and their implications on growth going forward. China is now expected to grow GDP at 8-9% in 2021 – which will be good for the world economy – but there are a number of risks covered here:
And finally, last night I was invited on BBC World News with Mariko Oi to discuss the Impeachment in the House and its implications on the stock market. Thanks to Mariko and Derek Cai for having me on.
As the stock market is a forward looking, discounting mechanism – I discussed the 3 key points the stock market is focused on:
1) President Elect Biden’s stimulus package announcement coming today (Thursday) – and whether the Senate will slow down his first 100 days by focusing on the past versus the future, 2) Earnings Season starting on Friday with the big banks and what we expect, and 3) The Fed’s commitment to let inflation run over 2% for a full year before raising rates (Vice Chair Clarida’s quotes from Wednesday evening):
Where’s the Opportunity?
So if it’s true we may get “ghosted” in the next couple of months, where’s the opportunity over the next few years?
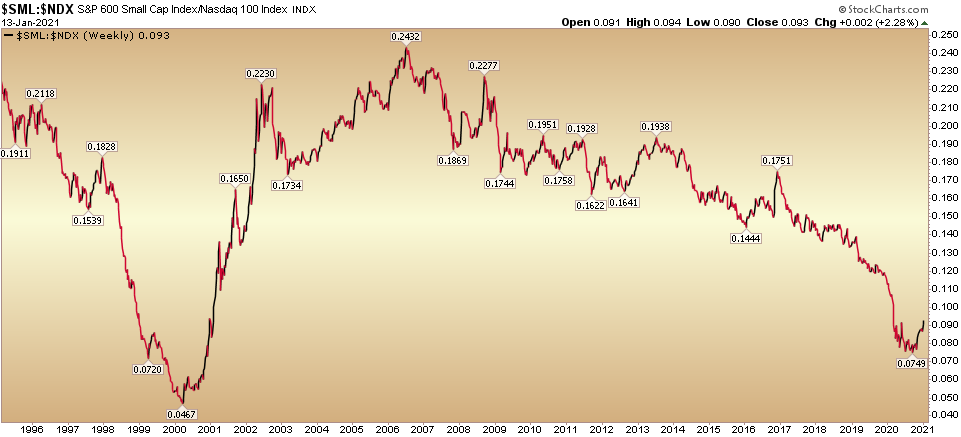
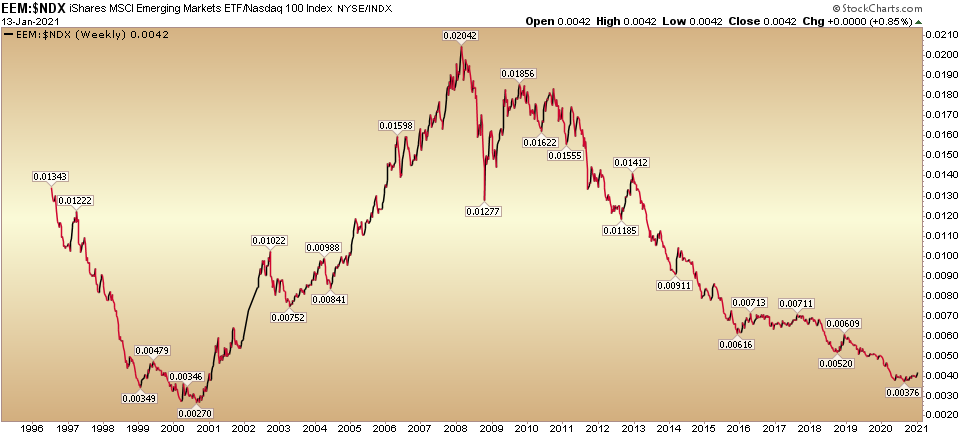
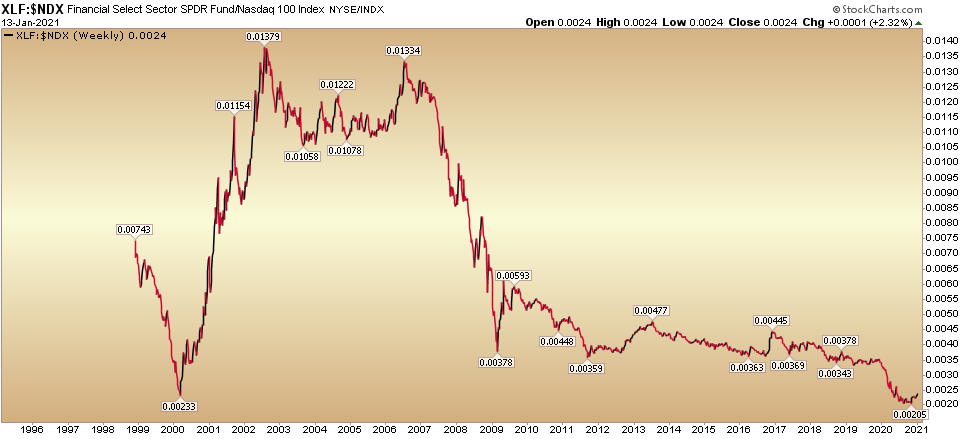
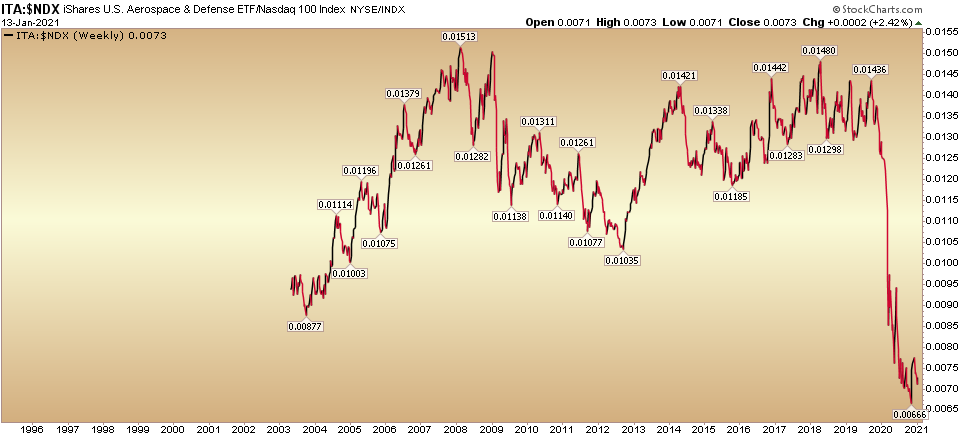
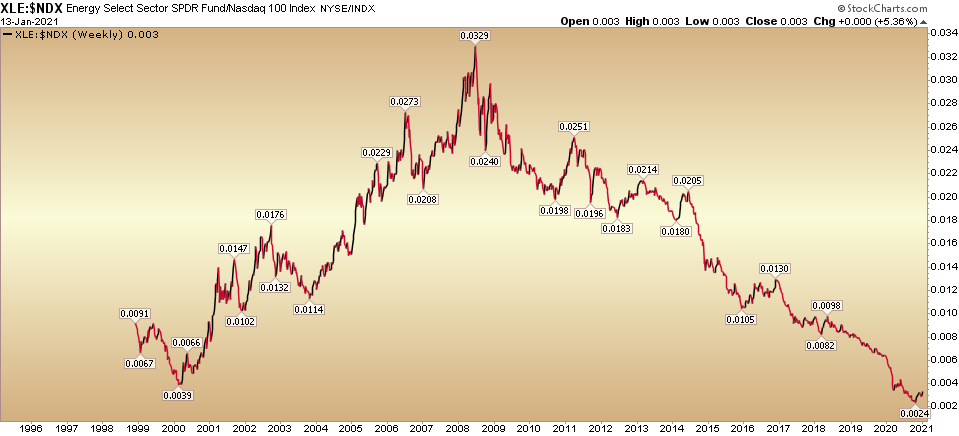
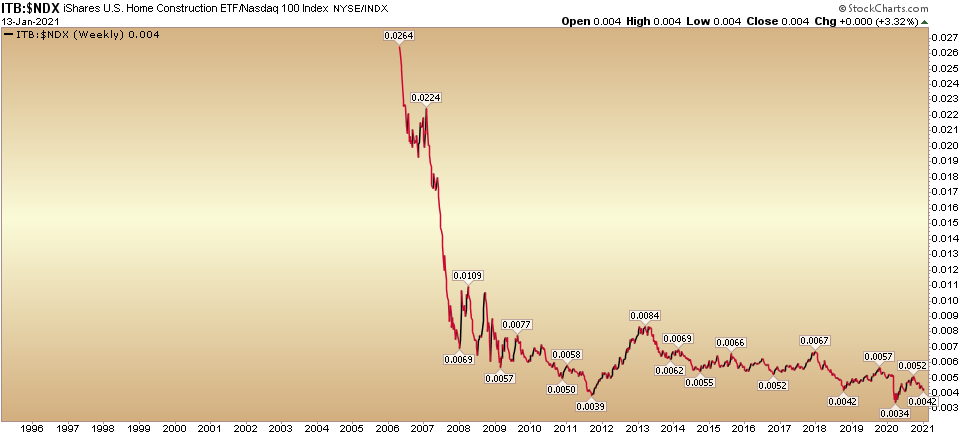
The following charts are known as ratio charts – where one instrument’s performance is compared to the second. Since “Big Tech” has carried the water in the last 3-4 years – and it would be historically anomalous to continue in the top spot – as we covered in the long-term performance table last week,
The Yogi Berra, “Fork in the Road” Stock Market (and Sentiment Results)…
here’s where we see opportunity (starting now and continuing for the nest few years). These asset classes below are compared to “Big Tech so we can visualize its recent outperformance and possible inflection moving forward.
In other words, you can use any “ghosting period” to stock up on any opportunities you may have missed in recent months when we were discussing them:
Small Caps
Emerging Markets
Financials (Banks)
Defense (and Aerospace)
Energy
Home Builders
Value over Growth
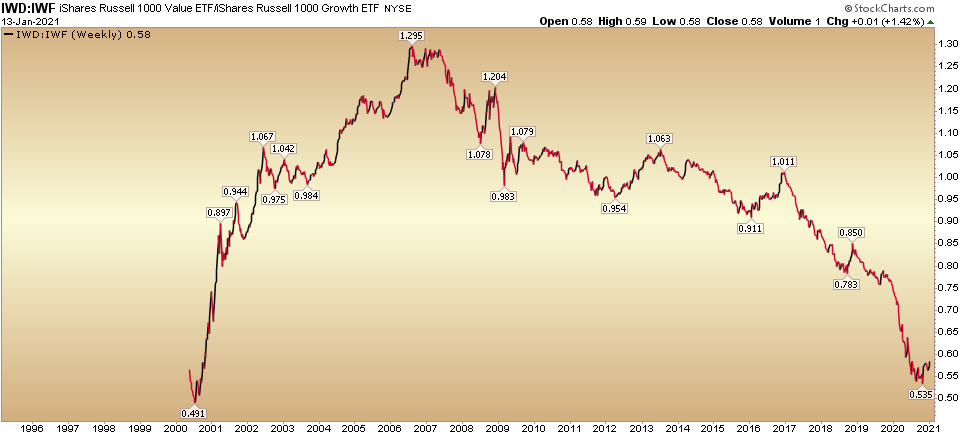
So there you have it. It you think you “missed it,” think again. The new game is just getting started…
We were met with skepticism when we laid out our case for buying banks and energy in our notes this Summer and Fall. Now everyone is getting on board (up 50-70+%). It’s time to “ghost” what worked for the last 3 years and dance with some new partners that will work for the next few years…
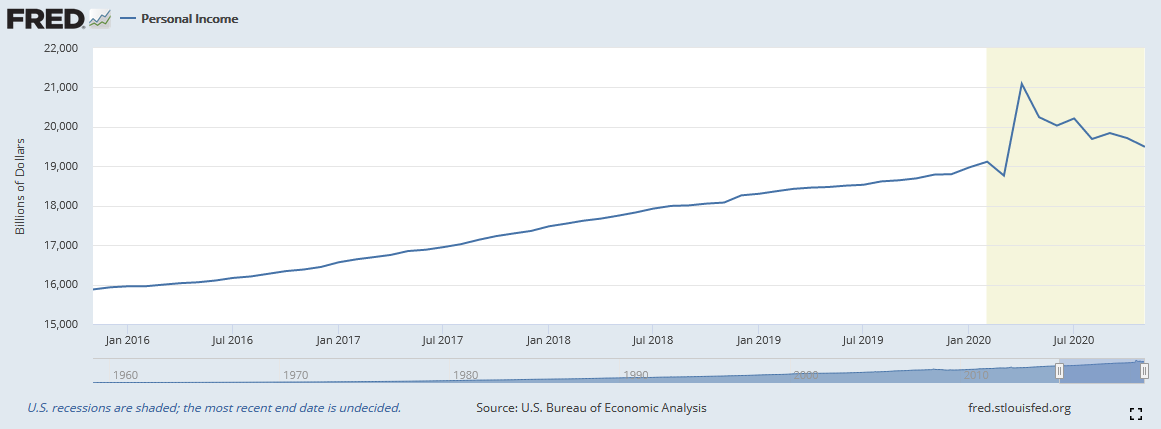
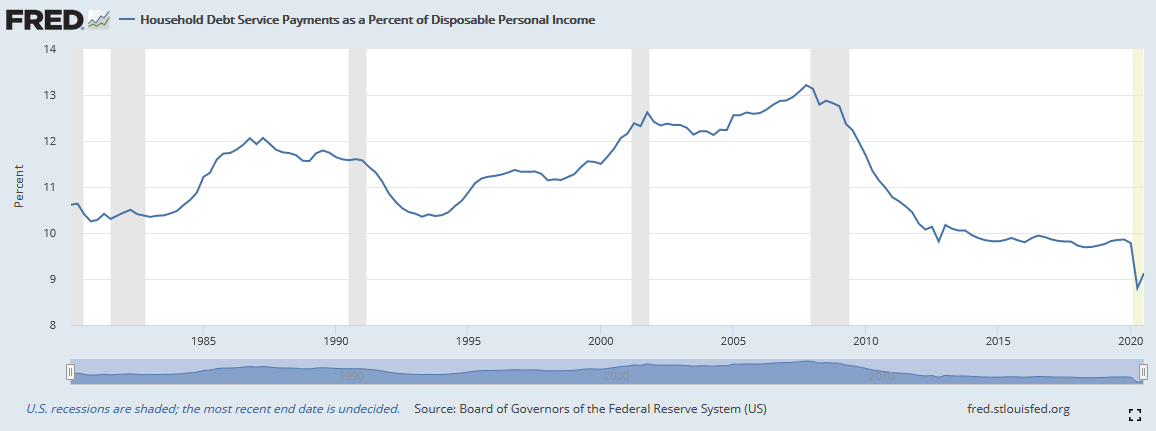
The Consumer Has Never Been Stronger
Personal Income
Household Debt Service as a % of Disposable Income
Personal Saving as a % of Disposable Income
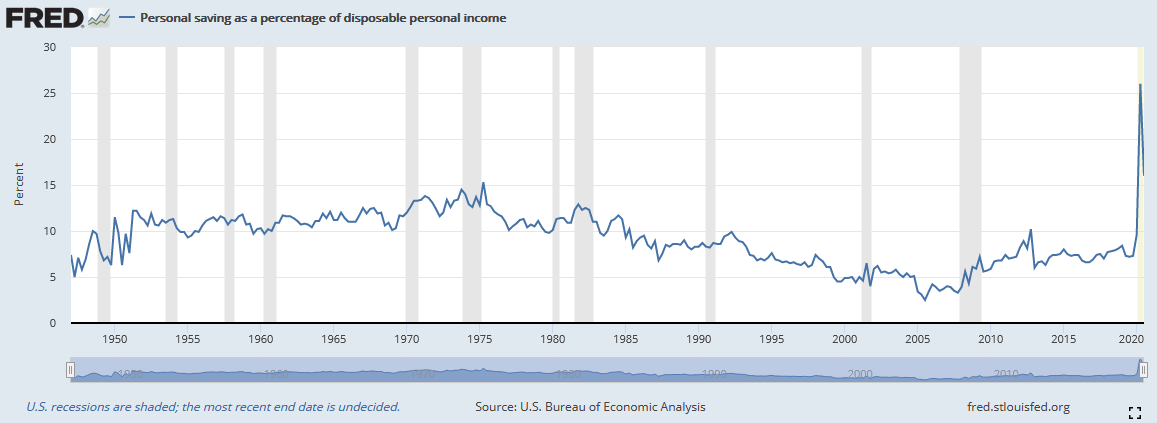
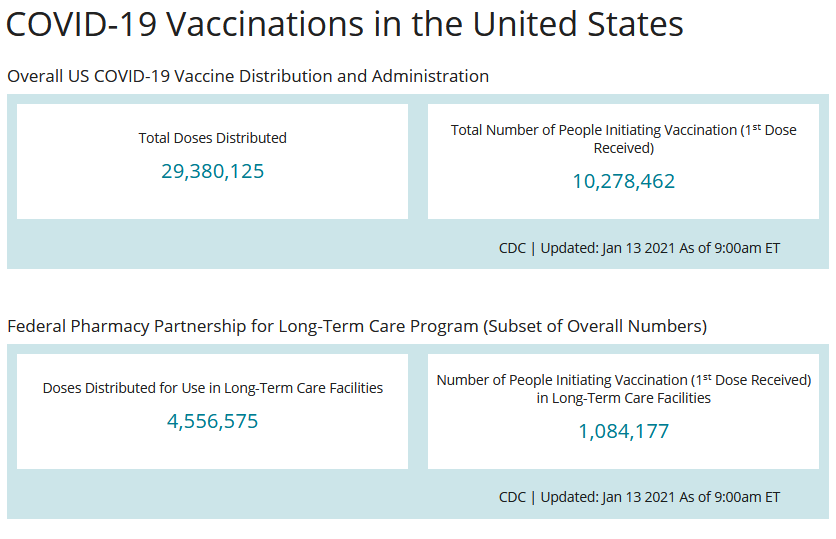
So how do we move all of the money that’s sitting in checking accounts, back into the economy? Very simple, the more vaccinations that are administered, the more consumers will unleash trillions of dollars of pent up demand.
While the administration of the vaccines started off slow, it is picking up pace with over 1M people per day now getting vaccinated (>10M total):
Now onto the shorter term view for the General Market:
In this week’s AAII Sentiment Survey result, Bullish Percent (Video Explanation) was not correct at time of publication (at 100%). They will be updating it later this morning. We will update it here when they have corrected their site.
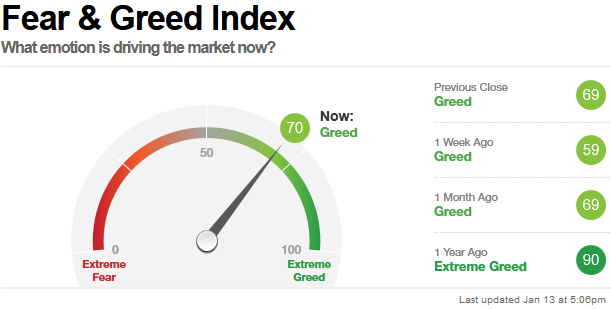
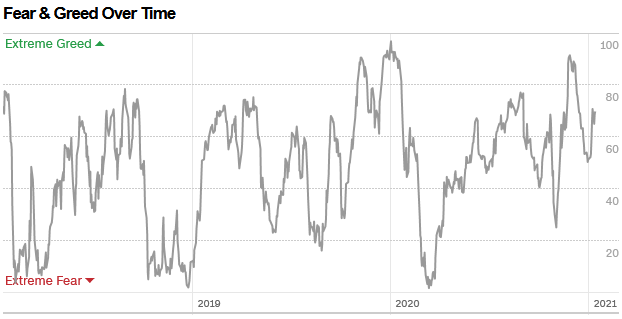
The CNN “Fear and Greed” Index rose from 60 last week to 70 this week. Greed is creeping back in. You can learn how this indicator is calculated and how it works here: (Video Explanation)
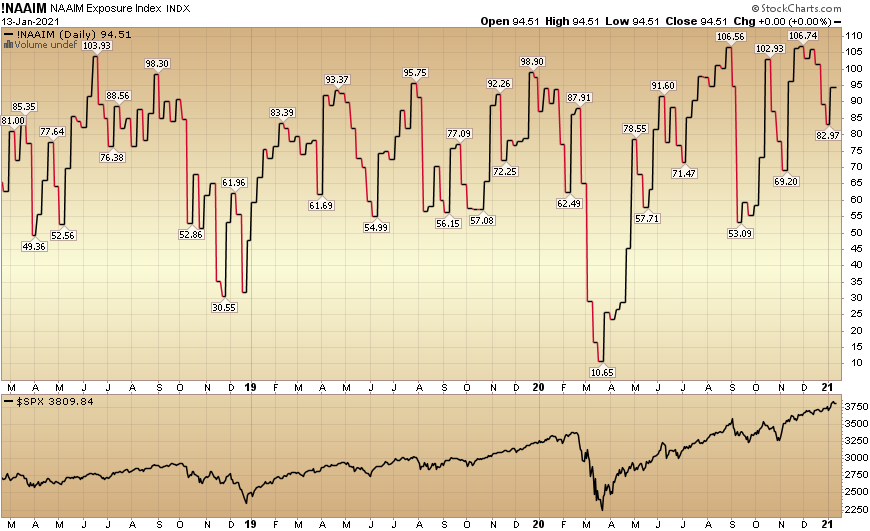
And finally, this week the NAAIM (National Association of Active Investment Managers Index) (Video Explanation) moved up to 94.51% this week from 82.97% equity exposure last week.
Our message for this week:
The stock market can correct in TIME or PRICE. While I do think we may push a bit higher first, I expect the market will finally begin to consolidate some gains in coming weeks.
This can be by simply grinding sideways for a month or two to digest the > 70% gains off the March Lows OR more likely get a health pullback. As we have stated in recent weeks, this is the beginning of a new business cycle and it does not pay to get too cute trying to predict the when and how much of a short term correction we will get.
As we saw after a monster rally off the lows in 2009, it did not pay to play the short term pullbacks in 2010 and 2011 – as you may very well have missed out on a decade long bull market run.
We’ll be using any weakness that potentially comes our way in Q1 to add more value/cyclical names (themes listed above) to hold for the next 3-5 years…
If you want more specifics, see my “Top 4 Stock Picks of 2021” on the Claman Countdown from 1/4/2021:


